Gold
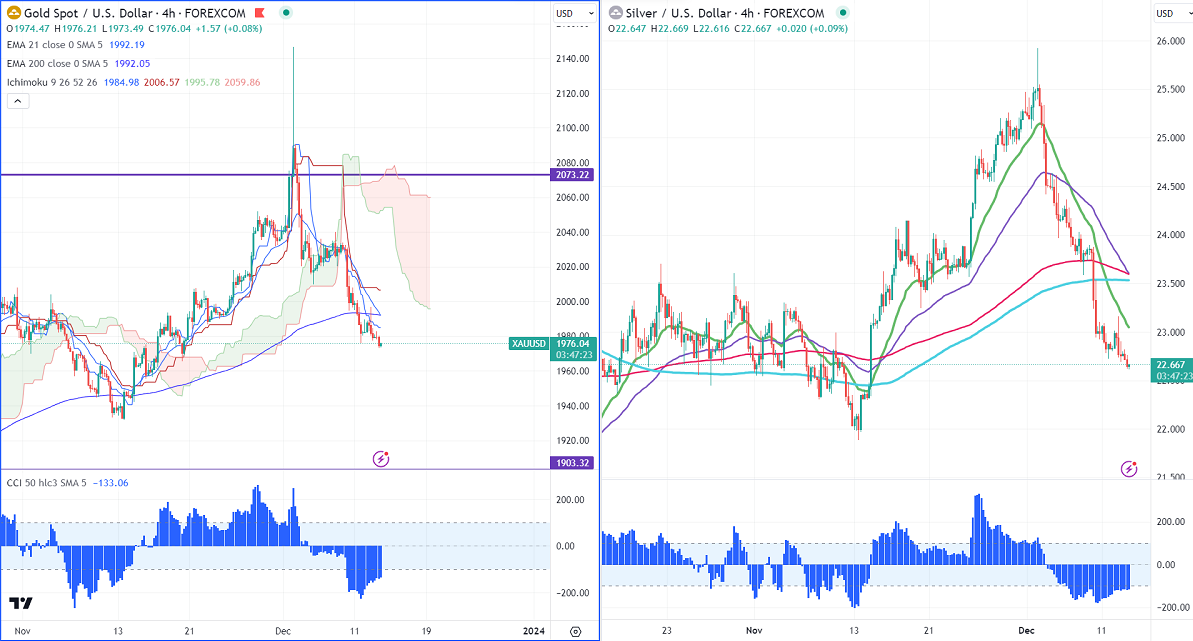
Ichimoku Analysis (4 hour chart)
Tenken-Sen- $1984.98
Kijun-Sen- $2006.54
Gold is trading lower ahead of the US FOMC policy meeting. It hit a low of $1977.26 and is currently trading at around $1978.75.
US Nov CPI came in line with expectations, with headline CPI coming at 0.10% m/m and core inflation rising at 0.30%. While yearly headline inflation declined to 3.1% from 3.2% the previous month. Markets eagerly await the Fed statement and dot plot for further direction. Any dovish comments from the Fed will push gold prices higher above the $2000 level.
Major economic data for the day
Dec 13th, 2023,
US PPI m/m (1:30 pm GMT)
US federal funds rate(7 pm GMT)
US dollar index- Bullish. Minor support around 102/100. The near-term resistance is 104.40/105.
According to the CME Fed watch tool, the probability of a no-rate hike in Dec decreased to 98.2% from 96% a week ago.
The US 10-year yield consolidating ahead of the FOMC meeting. The US 10 and 2-year spread widened to -53% from -34%.
Factors to watch for gold price action
Global stock market- Bullish (negative for gold)
US dollar index - Bullish (negative for gold)
US10-year bond yield- Bearish (Positive for gold)
Technical:
The near–term support is around $1970, a break below targets of $1950/$1932.The yellow metal faces minor resistance around $2000 and a breach above will take it to the next level of $2020/$2050.
It is good to sell on rallies around $2000 with SL around $2020 for TP of $1945.
Silver
Silver lost its shine after a minor pullback. The precious metal's upside is capped by a 200-day EMA ($23.20). Any daily close above $23.25 confirms a minor uptrend, a jump to $23.70/$24 is possible. Minor support is $22.60/$22/$21.80.
Crude oil
WTI crude pared most of its gains made this week. Markets await Crude inventories for further movement.
Major resistance- $75/80. Significant support- $68/$63.