


 Lithium Market Poised for Recovery Amid Supply Cuts and Rising Demand
  UBS Projects Mixed Market Outlook for 2025 Amid Trump Policy Uncertainty
  FxWirePro: EUR/AUD regains upwards momentum but unable to hold above 50%fib level
  FxWirePro: AUD/USD gains some ground but outlook is bearish
  US Gas Market Poised for Supercycle: Bernstein Analysts
  Gold Prices Slide as Rate Cut Prospects Diminish; Copper Gains on China Stimulus Hopes
  China's Refining Industry Faces Major Shakeup Amid Challenges
  FxWirePro- Major Pair levels and bias summary
  JPY Action Bias: EURJPY and CADJPY Emerge as Extremely Bullish Pairs to Watch
  FxWirePro- Major Crypto levels and bias summary
  FxWirePro: NZD/USD consolidates overnight gains, but loses momentum
  FxWirePro: GBP/AUD gains above 1.9200 level , upside pressure builds
  FxWirePro: GBP/USD rises as soft US data pressures dollar
  Geopolitical Shocks That Could Reshape Financial Markets in 2025
  FxWirePro: USD/CAD slips after Fed holds rates steady
  Indonesia Surprises Markets with Interest Rate Cut Amid Currency Pressure


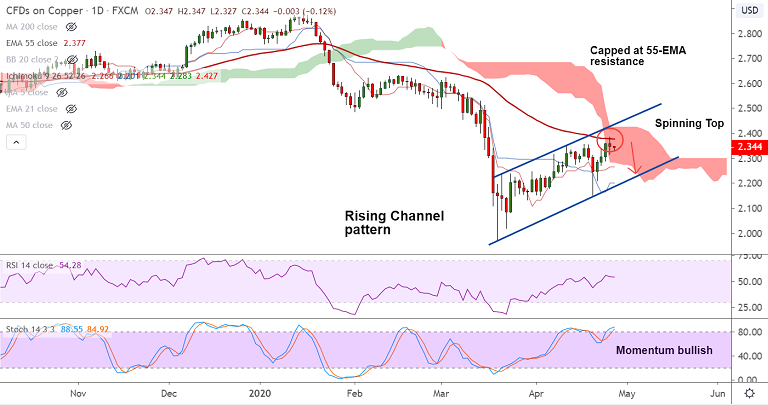
Copper chart - Trading View
Copper was trading 0.11% lower on the day at 2.344 at around 04:45 GMT.
Upside in the pair was capped at 55-EMA which is offering stiff resistance at 2.377.
A 'Spinning Top' formation on the daily candle on Monday suggests consolidation for the pair.
Intraday charts hold scope for upside as price action is above 200H MA and GMMA shows bullishness on the hourly charts.
Price action has edged higher from session lows at 2.327, holds support at 5-DMA.
The pair is extending trade in rising channel pattern and break above 55-EMA will see test of channel top at 2.435.
Failure at 55-EMA and retrace below cloud will negate upside bias.
Support levels - 2.328 (5-DMA), 2.302 (21-EMA)
Resistance levels - 2.377 (55-EMA), 2.435 (Channel top)


