


 FxWirePro: USD/ZAR firms ahead of Fed interest rate decision
  FxWirePro: USD/JPY eases ahead of Fed decision , Intervention risks linger
  FxWirePro:EUR/NZD gains some upside momentum but still bearish
  FxWirePro: EUR/AUD regains upwards momentum but unable to hold above 50%fib level
  FxWirePro- Major Crypto levels and bias summary
  FxWirePro: NZD/USD neutral in the near-term, scope for downward resumption
  FxWirePro: GBP/USD edges higher as traders await BoE guidance and UK fiscal clarity
  FxWirePro: GBP/AUD gains some upside momentum but still bearish
  FxWirePro: GBP/USD edges lower ahead of Fed policy verdict
  FxWirePro- Major Pair levels and bias summary
  FxWirePro- Woodies pivot (Major)
  FxWirePro: AUD/USD falls after softer-than-expected Australian Q2 CPI
  FxWirePro: USD/CAD runs out of steam but maintains bullish outlook
  EUR/JPY Holds Bullish Bias as Euro Extends Recovery
  FxWirePro : GBP/NZD strongly bearish despite upside attempts


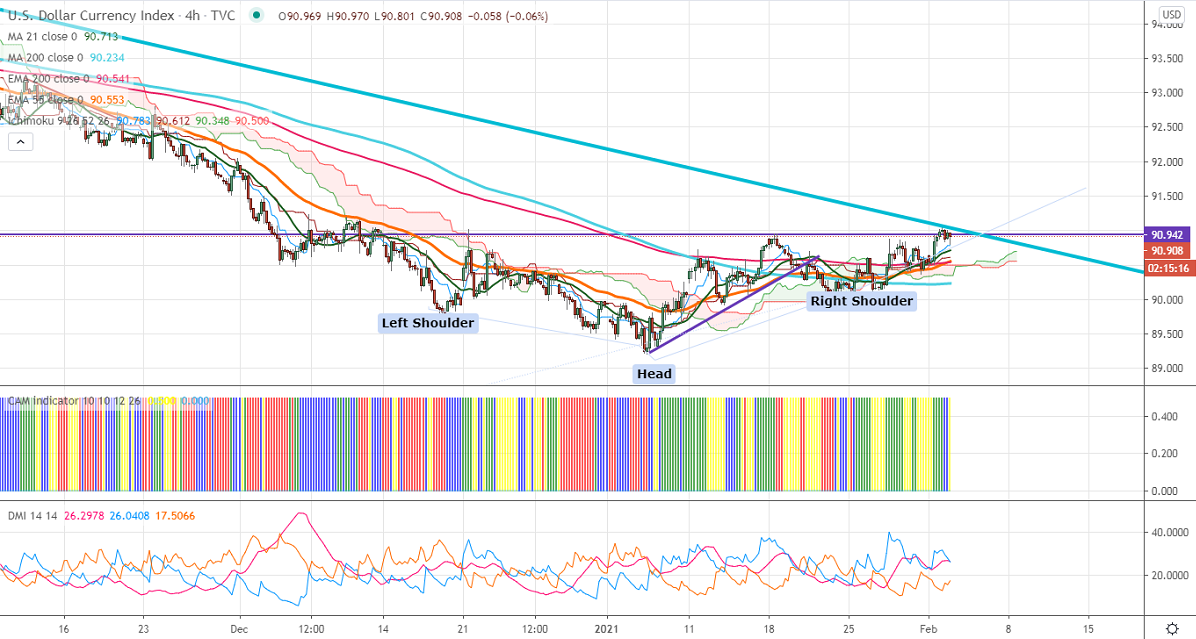
Chart Pattern- inverse head and shoulder
Ichimoku Analysis (4-Hour chart)
Tenken-Sen- 90.78
Kijun-Sen- 90.60
US Dollar index has declined slightly after breaking significant resistance 91. The index is in an uptrend as long as support 90.35 holds. It has formed an inverse head and shoulder pattern, any close above neckline 91 confirms further bullishness. The higher bond yields and optimistic US economic data is supporting the US dollar at lower levels. Markets eye US ADP employment data and Nonfarm payroll data this week for further direction
On the higher side, near-term resistance is around 91, convincing violation above targets 91.50. Significant bullishness only if it closes above 91.50. A jump till 93 likely.
The index facing strong support at 90.69; any indicative break below will take the index to 90.35/90/89.80/89.20.
It is good to buy above 91 with SL around 90 for TP of 93.


