


 EUR/JPY Holds Bullish Bias as Euro Extends Recovery
  NZD/JPY Flatlines Near 94.60: Will Key Support Reignite the Uptrend?
  FxWirePro- Major Pair levels and bias summary
  FxWirePro- Major Pair levels and bias summary
  FxWirePro: GBP/USD edges higher as traders await BoE guidance and UK fiscal clarity
  FxWirePro: GBP/AUD gains some upside momentum but still bearish
  FxWirePro: AUD/USD falls after softer-than-expected Australian Q2 CPI
  FxWirePro: USD/ZAR retreats but trend is still bullish
  FxWirePro: GBP/USD edges lower ahead of Fed policy verdict
  FxWirePro: USD/ZAR firms ahead of Fed interest rate decision
  FxWirePro: USD/JPY eases ahead of Fed decision , Intervention risks linger
  Buy the Dips on EUR/JPY: Bullish Structure Points to 188 Target Ahead of Fed
  FxWirePro: USD/ CNY remains soft ahead of Fed decision
  Major Forex Pairs Action Bias: GBPUSD and AUDUSD Turn Extremely Bearish
  FxWirePro: NZD/USD neutral in the near-term, scope for downward resumption


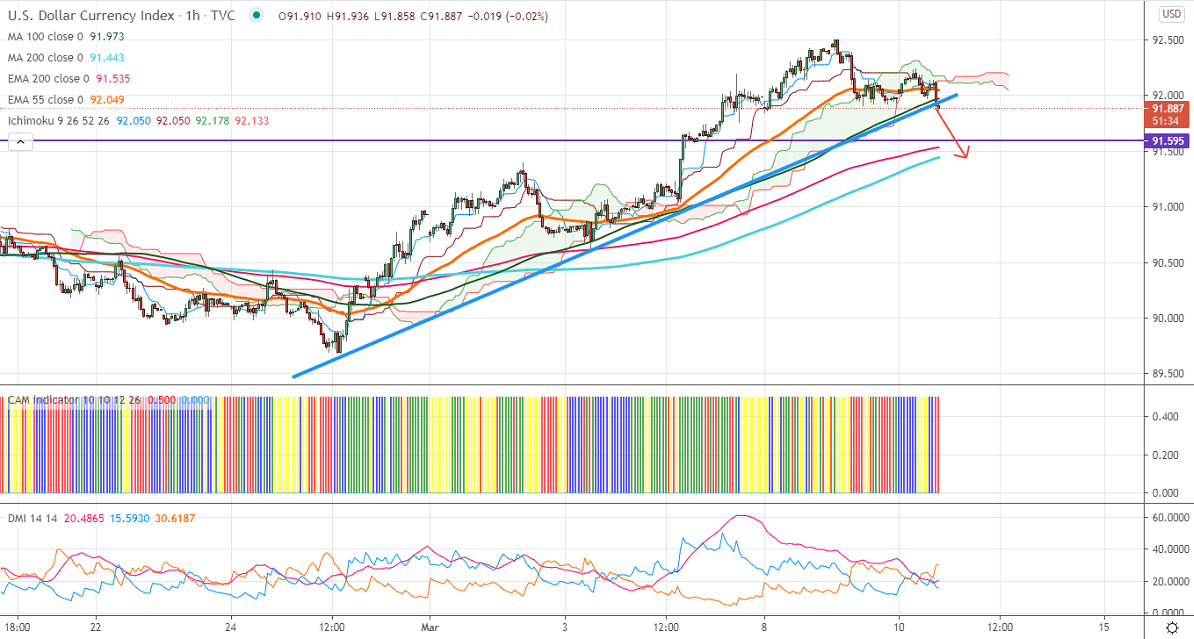
Short term trend – Bullish
Intraday trend – Bearish
Ichimoku Analysis (1-Hour chart)
Tenken-Sen- 92.06
Kijun-Sen- 92.06
US Dollar index has shown a minor decline after US CPI data. The inflation data came at 1.3% YoY compared to a forecast of 1.4%. While CPI ex-food and energy at 0.1% m/m vs 0.2% expected. US 10- year declined more than 1.5% after the data. Market eyes US bond auction at 18:00 GMT for further direction. The index hits an intraday high of 92.195 and is currently trading around 92.136.
The near-term resistance is around 92.25, convincing close above confirms minor bullishness. A jump to 92.76 (161.8% fib)/93 is possible.
The index is trading slightly below 91.95 (100- H MA); any indicative break below will take the index to 91.43 (200- H MA)/91.25.
Ichimoku analysis- DXY is trading below Tenken-Sen and Kijun –Sen (92.06). It is holding below the Ichimoku cloud (92.12).
Indicator (1 Hour chart)
CAM indicator – Bearish
Directional movement index –Bearish
It is good to sell on rallies around 92 with SL around 92.25 for a TP of 91.42.


