


 Bitcoin Cracks $75K as $1.3B ETF Exodus and Middle East Jitters Spook Bulls; Bears Eye $70K
  FxWirePro- Major Crypto levels and bias summary
  Ethereum Cracks Below $2,000 as Bitcoin Contagion Bites—Bearish EMA Stack Sets Sights on $1,700
  FxWirePro- Major Crypto levels and bias summary
  Ether Breaks Below $2,100: Triple EMA “Sell-the-Rally” Setup Targets $1,900
  ETH Cracks $2,100 in Bitcoin’s Wake as Bearish EMA Stack Deepens; Sellers Target $1,900 on Rallies
  FxWirePro- Major Crypto levels and bias summary


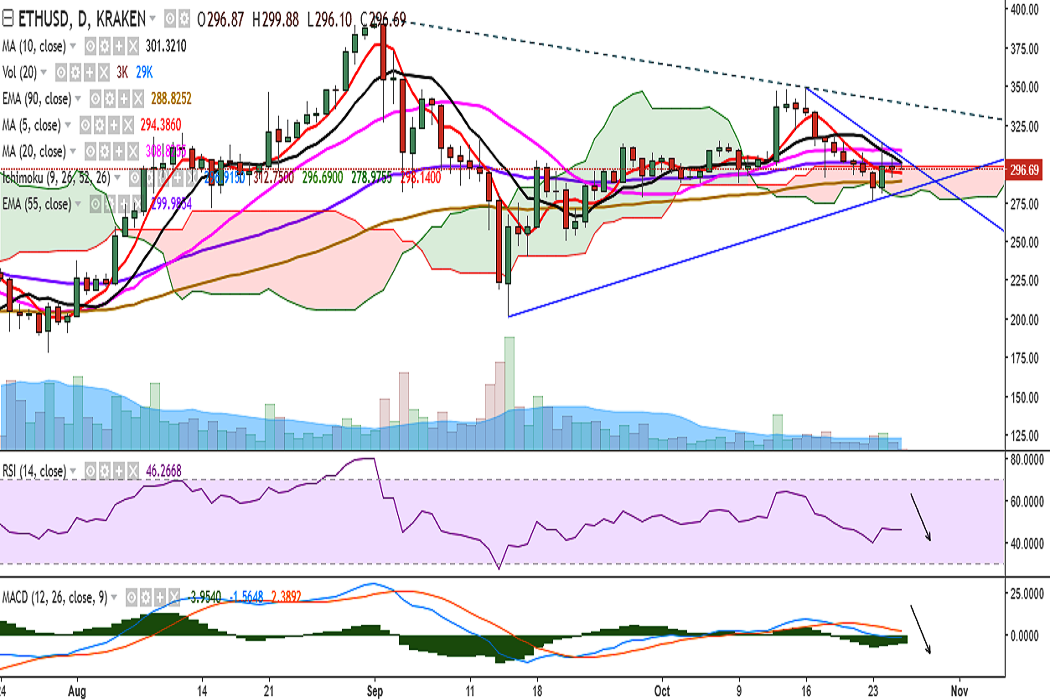
ETH/USD is trading in an extremely tight range as its upside is being capped by 10-DMA. It is currently trading at 296 levels at the time of writing (Bitstamp).
Ichimoku analysis of daily chart:
Tenkan Sen: 296.91
Kijun Sen: 312.75
On the upside, the pair faces strong resistance at 301 levels (10-DMA) and a break above would see it testing 308 (20-DMA)/321 (61.8% retracement of 349.50 and 276). Further strength would target 339 (trend line joining 395 and 349.50)/349 (October 16 high)/395 (September 01 high).
On the flipside, support is seen at 289 (100-DMA) and a break below would target 281 (trend line joining 201.28 and 276)/257 (61.8% retracement of 201.28 and 349.50). Further weakness would drag it to 235 (200-DMA).
Momentum studies: Bias appears bearish on the daily chart with RSI weak at 46, MACD line below the signal line. However, stochs have rolled over from the oversold zone.
The pair is extremely rangebound and a break below the trend line support at 281 would see further bearishness.
FxWirePro launches Absolute Return Managed Program. For more details, visit http://www.fxwirepro.com/invest

- News

- Economy

- Central Banks
- Investing
- Research
- Roundups
- Digital Currency
- Insights
- Technical Analysis
- Technology
- Business
- Law
- Health
- Nature
- Fintech
- Science
- Topic
- Opinions
- ©Econometrics LLC . All Rights Reserved.
FxWirePro: ETH/USD sees trend line support at 281, break below to see further downside
Thursday, October 26, 2017 7:12 AM UTC
Editor's Picks


- Market Data
Most Popular


