


 FxWirePro: GBP/USD climbs to 4 -week high as ceasefire deal gives bulls traction
  FxWirePro: EUR/AUD falls below 1.6600 level, plunge to test a key fibo grows
  GBPJPY Surges to 211.88: Sterling Bulls Target 215 Amid Broad-Based Buying
  Bitcoin Breaks the $70,000 Barrier: Bulls Target the $80,000 Horizon as Geopolitical Relief Ignites Crypto Markets
  Aussie Ascent: AUDJPY Charges Toward 112 as Bullish Momentum Hits Five-Day High
  FxWirePro:NZD/USD jumps as RBNZ warns of higher OCR potential
  FxWirePro: USD/ JPY slips as yen rallies after Mideast ceasefire declaration
  Ethereum Braces for Volatility: Technicals Turn Bearish as Geopolitical Tensions Loom
  FxWirePro- Major Crypto levels and bias summary
  FxWirePro: GBP/NZD reverses course, bias back to downside
  FxWirePro: USD/CNY falls to three-year high, scope for further downside
  FxWirePro: USD/ZAR continues to recovers , upside pressure builds
  Aussie Bulls Charge: AUD/JPY Rallies as Geopolitical Clouds Part
  Ethereum Reclaims Higher Ground: Ether Bulls Target $2,700 as Middle East Tensions Thaw
  Bitcoin's Tug-of-War: Bulls Eye 80,000 USD Despite Turbulent ETF Outflows
  FxWirePro: EUR/ NZD downside pressure builds, key support level in focus
  EUR/JPY Breaks Out: Euro Surges Past 185.00 Resistance Amid Strong Bullish Momentum


The double top pattern has occurred on monthly plotting with top 1 at 1.5831, top 2 at 1.6585 and neckline at 1.3812 levels, the current prices slid below EMAs again, the next major trend direction is dependent on a question “Can bears manage to break below strong support @ 1.3812 (double top neckline)?”
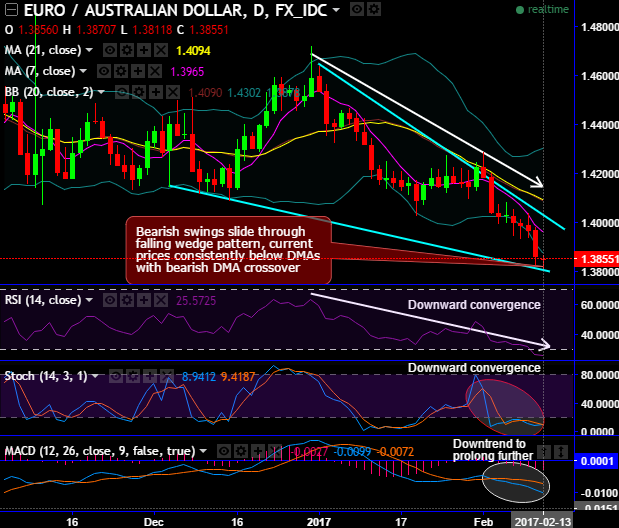
While on daily plotting, bearish swings slide through falling wedge pattern, the current prices consistently have been dipping below DMAs with bearish DMA crossover (21DMA crosses over 7DMA).
On 4H chart, after breaking major supports at DMAs, 1.40 and 1.3940 levels, bear streaks have been intensified.
Both leading and lagging indicators indicates bearish momentum by converging downwards to these price dips on both daily as well as monthly charts.
RSI: Currently, RSI (14) has been clearly converging downwards to the prevailing price dips on daily as well as monthly timeframes that signal the strength in selling sentiments.
Stochastic: This leading oscillator has approached oversold territory but no convincing %k crossover. But daily stochs evidence %D crossover right from overbought zones that conforms to these price dips with intensified selling momentum.
MACD on the other hand evidences bearish crossover below zero level that signals price slumps to extend further.
Well, there minor upswings on intraday charts use them as shorting opportunity as the bearish signals from 4H charting is deemed as the early signals of the further bearish streaks. While overall the major downtrend of this pair remains intact, and it is likely to extend further.


