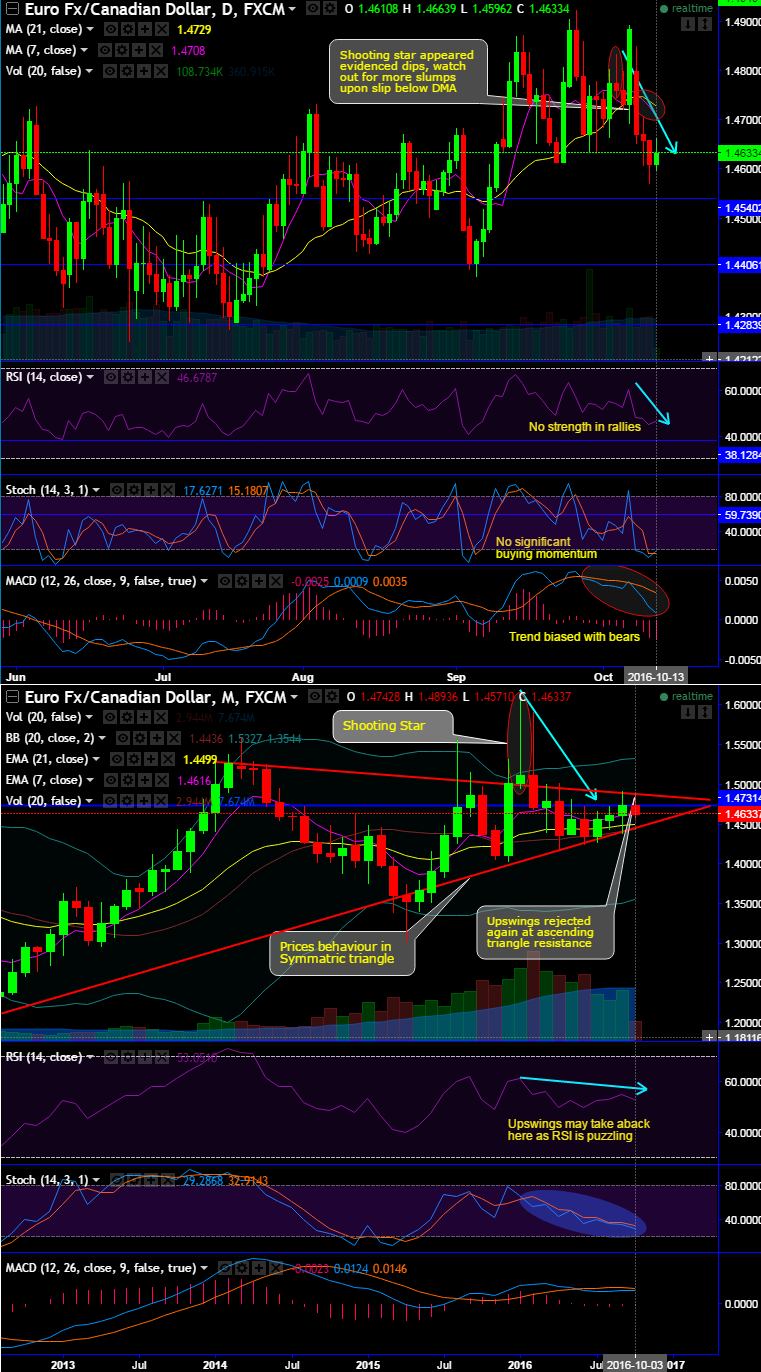
Please observe last two months’ upswings are restrained exactly at ascending triangle’s upper side (i.e. at 1.4893 levels).
The current prices have slid way below 7DMA and 21DMA and for now 7DMA crosses below 21DMA, for now, we foresee all chances of breaching supports at 1.4612 levels with intensified selling interest in this pair.
A “shooting star” pattern candle formed at peaks of 1.4760 levels on daily plotting. As a result, ever since then you can observe corresponding price drops in intraday charts.
RSI looks healthily converging with every price declines below 47 levels; RSI signifies the same stance no deviation on even weekly graph, so the prevailing down streaks may sustain for some more slumps in the weeks to come.
While another leading oscillator (slow stochastic) approaches below 20 levels but no signs of %K crossover, and indicates the bears don’t seem to lose this momentum atleast in near term built by healthy volumes.
These bearish swings have been slipping through a symmetric triangle pattern, testing 7EMAs and sloping line of the triangle as a stiff resistance.
Stay short via futures contracts of November month delivery for targets of 1.4540 levels upon a break below 1.4612 levels, keep a strict stop loss of 1.4660 levels.


