


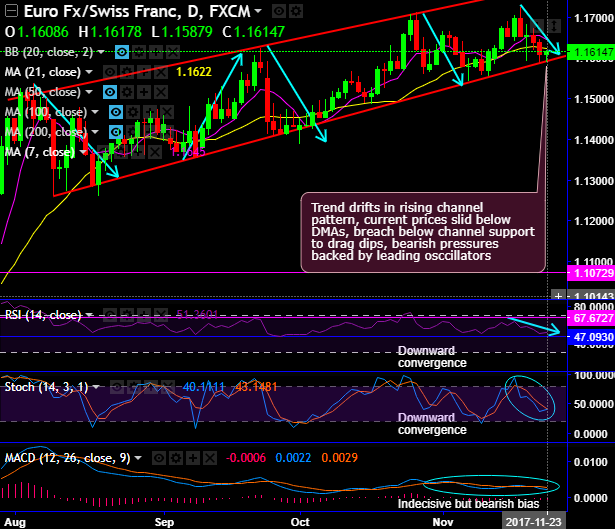
Chart pattern formed- Rising channel (on daily plotting) and break-out of long-lasting range (on monthly plotting).
The short-term trend now tests the rising channel support at 1.1587 levels, the current prices are hovering at 21DMAs. Consequently, price bounces are seen today, one could observe as and when the price hits channel support line and resistance line we’ve seen tides and troughs accordingly, but for now, the ongoing bullish pressures are not backed by leading oscillators.
RSI, so far, has been converging downwards to the price dips. But, historically, it has shown the strength at 47 marks, currently, the leading oscillator is evidencing the similar sense of strength but not convincing as the fast stochastic curves are indecisive at the moment.
We foresee less likely to spike any further if the rallies don’t manage to break out above the stiff resistance at 1.1630 levels.
Please be noted that it has struggled these levels to break-out, as a result, the shooting star patterns have occurred exactly at these levels (refer circular area on daily plotting) and they have shown the pair’s weakness at that juncture.
On a broader perspective, the major downtrend that was in consolidation phase has now gone into reversal mode. It seems to be prolonging the upside traction after break-out of range resistance, please note that the major trend was stuck in the range that was long lasting (from August 2015 to July 2017).
Both leading & lagging indicators substantiate this bullish environment (refer monthly chart).
7ema crosses over 21EMA levels which is bullish EMA crossover that indicates the uptrend extension further.
Additionally, MACD has also shown bullish crossover which is again a substantiation to prolong the prevailing uptrend (refer monthly plotting).
Trade tips:
As the short term trend has tested the channel baseline but no confirmation from the momentum oscillators nor from trend indicators, it is wise to initiate boundary binary options strategy by giving more space to the upper strikes at 1.1656 (tolerance 10 pips above 7DMA) and lower strikes at 1.1587 levels (channel base), the strategy is likely to fetch leveraged yields as long as underlying spot FX remains within these strikes on or before the binary expiry duration.
Currency Strength Index: FxWirePro's hourly EUR spot index is displaying shy above -24 levels (bearish), while hourly CHF spot index was inching higher towards -30 (bearish) while articulating (at 08:54 GMT). For more details on the index, please refer below weblink:
http://www.fxwirepro.com/currencyindex
FxWirePro launches Absolute Return Managed Program. For more details, visit:


