


 Energy Sector Outlook 2025: AI's Role and Market Dynamics
  European Stocks Rally on Chinese Growth and Mining Merger Speculation
  Fed May Resume Rate Hikes: BofA Analysts Outline Key Scenarios
  Relief Rally Extends to 112.75, but AUDJPY EMA Structure Favors Selling
  U.S. Stocks vs. Bonds: Are Diverging Valuations Signaling a Shift?
  U.S. Treasury Yields Expected to Decline Amid Cooling Economic Pressures
  Moody's Upgrades Argentina's Credit Rating Amid Economic Reforms
  Geopolitical Easing Fuels AUDJPY Rally Toward 115 — Buy Dips at 113
  Geopolitical Shocks That Could Reshape Financial Markets in 2025
  FxWirePro: NZD/USD jumps after US and Iran agree preliminary deal
  FxWirePro: USD/ZAR edges higher, set to stay on back foot
  Gold Prices Slide as Rate Cut Prospects Diminish; Copper Gains on China Stimulus Hopes
  US Gas Market Poised for Supercycle: Bernstein Analysts
  FxWirePro: EUR/AUD loses upside momentum but outlook is bullish
  GBPJPY Coil Tightens: Is a Bullish Break Above 215.60 Imminent?


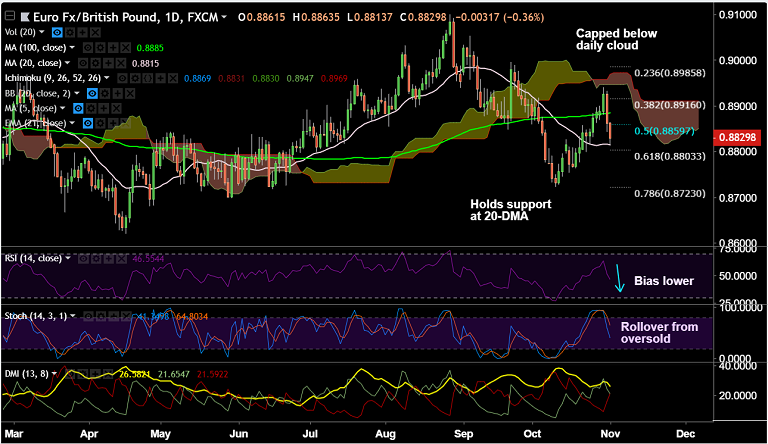
EUR/GBP chart on Trading View used for analysis
- EUR/GBP is holding support at 20-DMA, break below will see further downside.
- 5-DMA has turned lower and price action has slipped below 21-EMA.
- Stochs and RSI are biased lower and Stochs have shown a rollover from overbought levels.
- Upside remains capped at 110-EMA and we see bullish reversal only on break above 100-DMA.
- Break below 20-DMA finds next major support at 61.8% Fib at 0.8803 ahead of 0.8723 (Oct 10 low)
Support levels - 0.8815 (20-DMA), 0.8803 (61.8% Fib), 0.8723 (Oct 10 low)
Resistance levels - 0.8885 (100-DMA), 0.89, 0.8915 (38.2% Fib)
Recommendation: Watch out for break below 20-DMA for further weakness.
For details on FxWirePro's Currency Strength Index, visit http://www.fxwirepro.com/currencyindex.


