
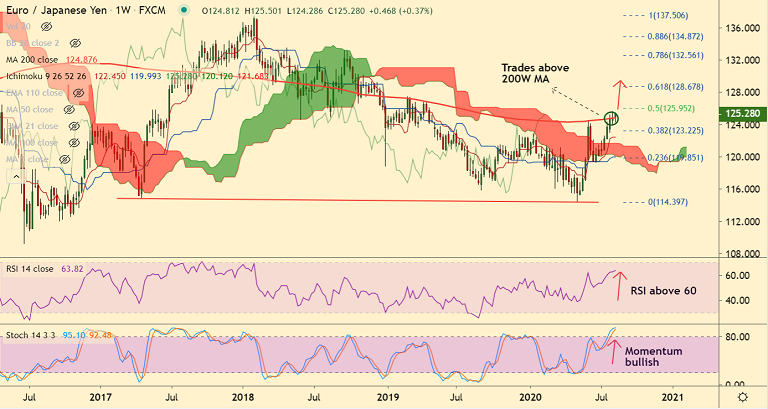
EUR/JPY chart - Trading View
Technical Analysis: Bias Bullish
GMMA Indicator
- Major and minor trend are strongly bullish on the daily charts
- On the weekly charts, minor trend is bullish, while major trend is turning bullish
Ichimoku Analysis
- Price action is above cloud on the daily and weekly charts
- Chikou span is also biased higher suggesting continuation of uptrend
Oscillators
- Stochs and RSI support strong bullish momentum on the weekly charts
- On the daily charts, Stochs and RSI have rolled over from overbought levels and are resuming upside
Bollinger Bands
- Bollinger bands are widening on the intraday and weekly charts
- High volatility with bullish momentum to drive further gains
Major Support Levels: 124.87 (200W MA), 123.95 (21-EMA)
Major Resistance Levels: 125.95 (50% Fib), 127.50 (Feb 2019 high)
Summary: The pair trades with a strong bullish momentum. Price action has retraced brief dip below 200H MA and is set to resume upside. Weekly close above 200W MA will reinforce bullish stance.


