
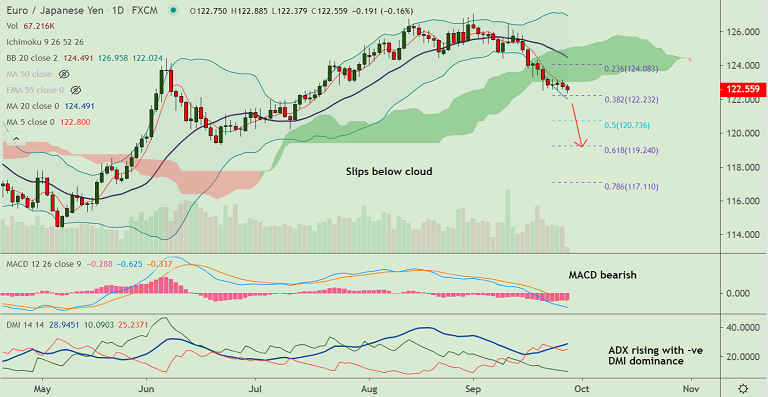
EUR/JPY chart - Trading View
Technical Analysis: Bias Bearish
GMMA Indicator
- Minor trend is strongly bearish, major trend is turning bearish on the daily charts
- On the weekly charts, minor trend is bearish, while major trend is neutral
Ichimoku Analysis
- Price action is below cloud on the daily charts
- Tenkan, Kijun and Chikou span are sharply lower
Oscillators
- Stochs and RSI are in highly oversold levels with a strong bearish bias
Bollinger Bands
- Bollinger bands are widening on the daily charts signaling rising volatility
Major Support Levels: 122.32 (38.2% Fib), 120.88 (200-DMA), 120.73 (50% Fib)
Major Resistance Levels: 122.79 (5-DMA), 123.32 (200H MA), 123.90 (55-EMA)
Summary: EUR/JPY trades with a bearish bias. MACD and ADX support weakness in the pair. Rising volatility with strong bearish momentum is likely to drive prices lower. Immediate support lies at 38.2% Fib at 122.23. Break below will see test of 200-DMA at 120.88.


