


 Mexico's Undervalued Equity Market Offers Long-Term Investment Potential
  Wall Street Analysts Weigh in on Latest NFP Data
  Lithium Market Poised for Recovery Amid Supply Cuts and Rising Demand
  FxWirePro: USD/CNY hits one –month high, scope for further upside
  NZDJPY: The Kiwi Yen's Bull Run Hits a Brick Wall at 92 — Sell the Rally?
  UBS Projects Mixed Market Outlook for 2025 Amid Trump Policy Uncertainty
  UBS Predicts Potential Fed Rate Cut Amid Strong US Economic Data
  Geopolitical Shocks That Could Reshape Financial Markets in 2025
  Trump’s "Shock and Awe" Agenda: Executive Orders from Day One
  Energy Sector Outlook 2025: AI's Role and Market Dynamics
  EURJPY Bounce Loses Steam Below 184 — Sell-the-Rally Setup Eyes 183 Target
  Oil Prices Dip Slightly Amid Focus on Russian Sanctions and U.S. Inflation Data
  Global Markets React to Strong U.S. Jobs Data and Rising Yields
  Gold Prices Slide as Rate Cut Prospects Diminish; Copper Gains on China Stimulus Hopes
  Bitcoin Sheds $491M in ETF Outflows and Retreats Below $64K; Sellers Reload for $50K
  Moldova Criticizes Russia Amid Transdniestria Energy Crisis
  FxWirePro: GBP/AUD sustains gains as uptrend remains strong


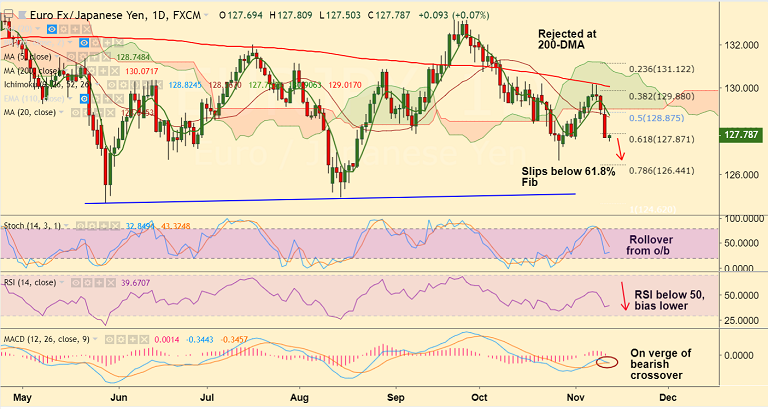
EUR/JPY chart on Trading View used for analysis
- EUR/JPY is trading 0.52% higher on the day at 128.90 at the time of writing.
- The pair has been struggling at stiff resistance in 129 to 129.23 zone, break above required for further gains.
- Price action is raging in 'Symmetric Triangle' pattern and breakout will provide clear direction.
- Technical analysis for the day shows neutral bias. RSI and Stochs are flat and inconclusive.
- Breakout above cloud base and 55-EMA could see test of 200-DMA.
- On the flipside we see strong support at 127.35 (major trendline). Break below could see weakness till 126.63 (Oct 26 low)
Support levels - 128.72 (5-DMA), 127.35 (trendline), 126.63 (Oct 26 low)
Resistance levels - 129.23 (55-EMA), 129.93 (200-DMA)
For details on FxWirePro's Currency Strength Index, visit http://www.fxwirepro.com/currencyindex.


