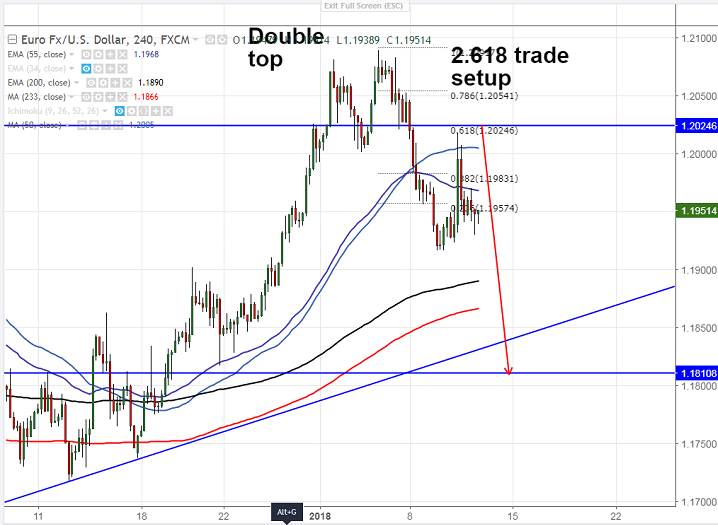
Major resistance – 1.2020 (61.8% fib). EUR/USD has shown a good upside yesterday till 1.20176 on rumors came that China might halt or reduce U.S treasury purchase. The pair started to decline from that level. The pair ha…
EUR/USD has shown a good upside yesterday till 1.20176 on rumors came that China might halt or reduce U.S treasury purchase. The pair started to decline from that level. The pair has formed a double top around 1.20891. The bullish continuation only above 1.2092. It is currently trading around 1.19475.
Market eyes US PPI, initial jobless claims data to be released today for further direction.
Technically, near term is around 1.1905 (20- day MA) and any break below will drag the pair down till 1.1854 (61.8% fib)/1.1800.Minor weakness can be seen only below 1.1800.
On the higher side, near term resistance is around 1.2025 (61.8% fib) and any break above will take the pair till 1.20520/1.20920.
It is good to sell on rallies around 1.1965-70 with SL around 1.2025 for the TP of 1.1845/1.1805.