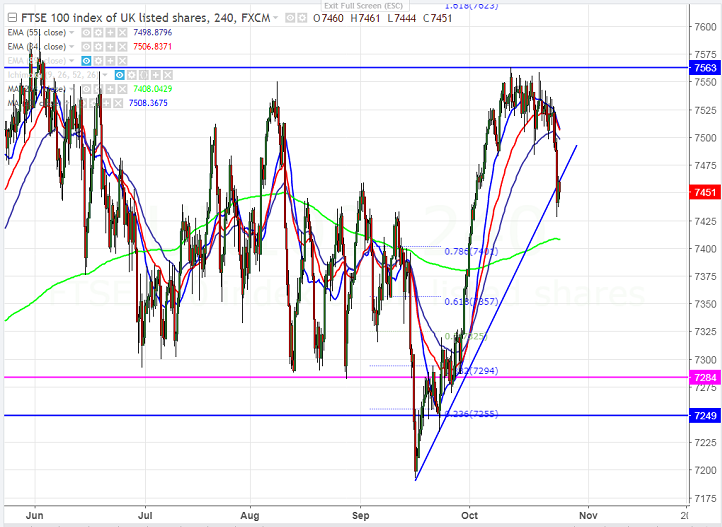
- FTSE100 has formed a temporary top around 7559 and started to decline sharply from that level. The index dipped till 7428 and is currently trading around 7450.
- The index’s short term trend line support has broken 7457 (trend line joining 7193 and 7234) and this confirms minor weakness. Any convincing break below trend line support will drag the FTSE100 down till 7408 (233- day MA)/7334 (61.8% Fibo)/7193.
- The near term resistance is around 7560 and any break above will take the index till 7623 (161.8% fibo)/7725 (161.8% fibo).
- Overall bullish continuation only above 7600.
It is good to sell on rallies around 7500-7510 with SL around 7560 for the TP of 7335/7195.


FxWirePro- Major Pair levels and bias summary
FxWirePro- Major Crypto levels and bias summary
FxWirePro: EUR/NZD advances as kiwi weakness after RBNZ's Breman comments
ETHUSD Dips Below $3000 on BOJ Rate Hike Fears: Buy the Dip at $2700, Targeting $4000?
FxWirePro- Woodies Pivot(Major)
FxWirePro: EUR/CAD gaining momentum for a move towards 1.6250 level
FxWirePro: USD/JPY slips as yen gains ahead of BOJ meet
FxWirePro: USD/CAD pauses decline,critical support lies ahead
FxWirePro: GBP/AUD gives up early gains after UK GDP shock
FxWirePro- Major European Indices
FxWirePro: AUD/USD dips on soft China data
FxWirePro: USD/CNY outlook weaker on renewed downside pressure
CAD/JPY Dips on Soft Canadian CPI: Buy the Dip to 115?
FxWirePro: GBP/USD steadies ahead key data, BoE event risk
FxWirePro: USD/ZAR attracts selling interest, could be on verge of a bigger drop
FxWirePro: USD/CNY outlook weaker on renewed downside pressure 


