


 FxWirePro- Major Crypto levels and bias summary
  FxWirePro:USD/JPY climbs back above 160.00 after BOJ rate decision
  NZDJPY Bullish Rebound: Buy Dips as EMAs Align for 97 Target
  AUD/JPY Slips Below 112 as BOJ Intervention Sparks Bearish Momentum: Sell the Rallies
  FxWirePro: GBP/AUD drifts lower after BOE rate decision
  Major European Indices Score Extremely Bullish: DAX Eyes 26000, CAC Targets 8600, FTSE100 at 11000 – Key Levels to Watch
  FxWirePro- Woodies pivot (Major)
  FxWirePro: AUD/USD gains some ground but outlook is bearish
  Nikkei Surges Past 65,000 on Suspected Yen Weakness: Tech Giants Like Advantest and NEC Lead Explosive Gains
  FxWirePro- Major Pair levels and bias summary
  FxWirePro: GBP/USD rises as soft US data pressures dollar
  FxWirePro- Woodies pivot (Major)
  FxWirePro: USD/CAD retreats after Canada posts stronger-than-expected GDP growth
  NZDJPY Retreats on Yen Strength – Bearish Setup Targets 90 After Hitting 92.75 Low
  FxWirePro: EUR/ AUD dips below 1.6400 level, focus on near term support
  FxWirePro- Major Pair levels and bias summary
  FxWirePro: USD/CNY dips to hit three year low,scope for further downside


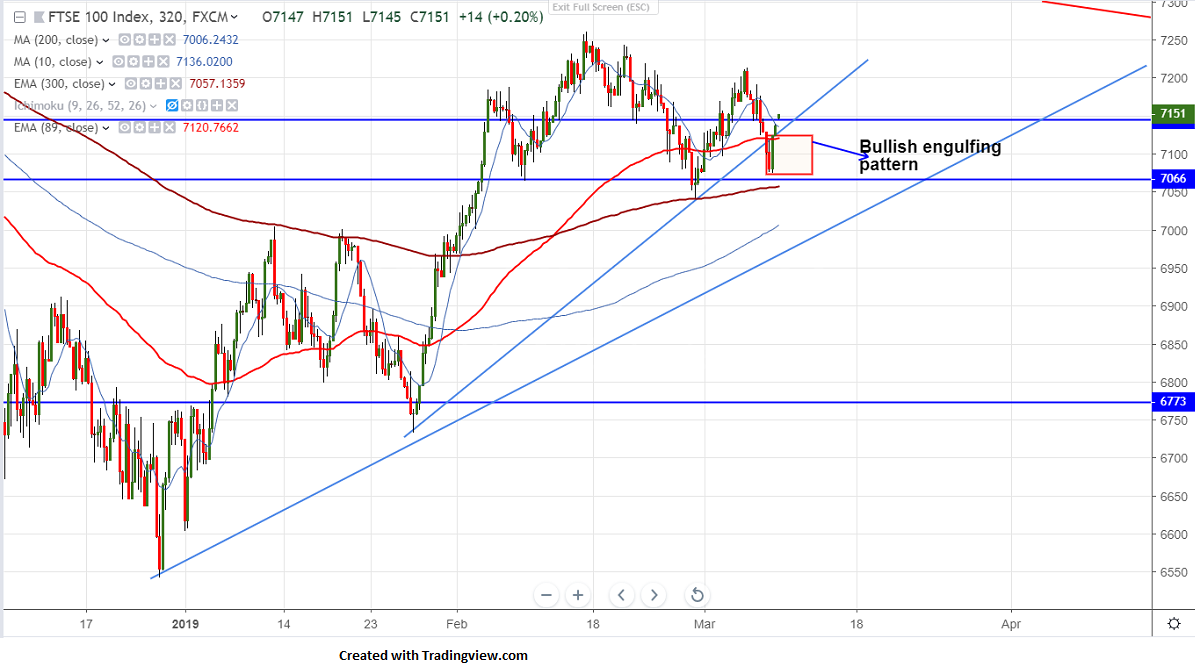
Candlestick pattern- Bullish engulfing pattern
FTSE100 has halted its three day of decline and recovered more than 60 points from low of 7075 made on Mar 8th 2019. The index was weak on Friday on weak US jobs data. US market especially S&P500 declined below 200 day MA till 2720 and shown a good recovery.The jump in FTSE100 was supported by weak pound and has lost more 100 pips on Friday.
On the lower side, near term support is around 7095 and any violation below will drag the index down till 7075/042. Minor trend reversal only below 7042. Any violation below 7042 targets 6990.
The near term resistance is around 7145 (10- 8H MA) and any jump above that level will take the index till 7169/7215. Any break above 7261 confirms bullish continuation.
It is good to buy on dips around 7115-20 with SL around 7075 for the TP of 7215/7260.


