
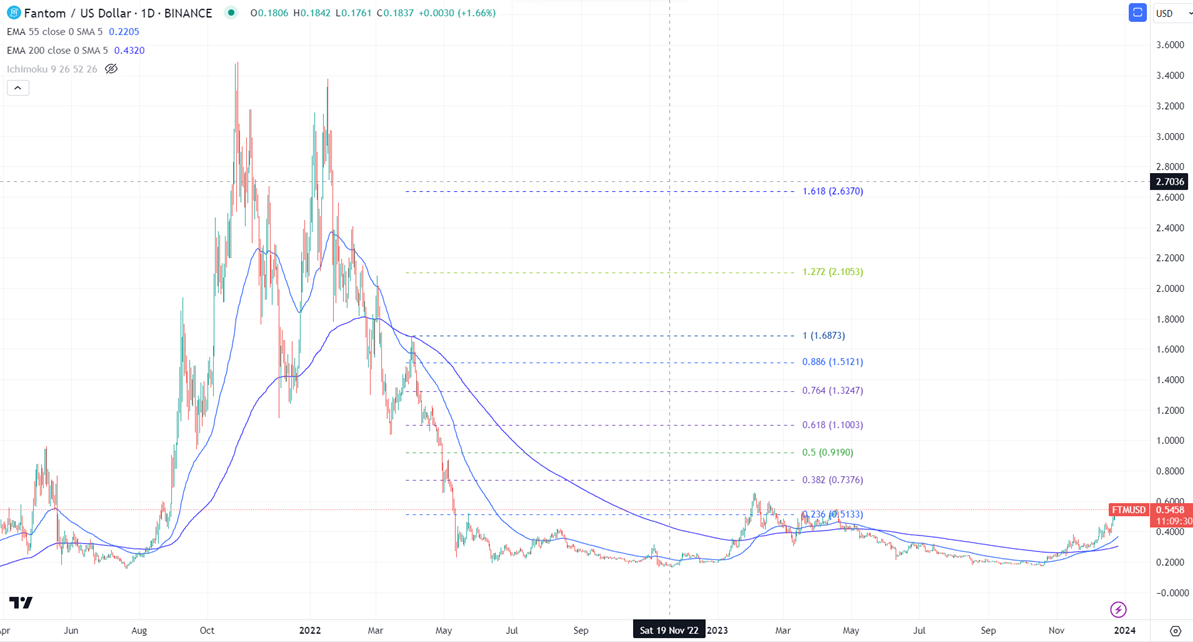
FTMUSD was one of the best performers the previous week.
Any weekly close above $0.60 confirms further bullishness.
FTMUSD was the best performer and surged more than 50% in the past week. The pair holds well above the short-term (21 and 55 EMA) and long-term moving average. It hit a high of $0.5671 and is currently trading around $0.5438.
The bullish invalidation can happen if the pair closes above $0.60. On the lower side, the near-term support is $0.470. Any break below targets $0.40/$0.280. Significant downtrend if it breaks $0.230.
The immediate resistance stands at around $0.60. Any breach above confirms a minor pullback. A jump to $0.740/$0.90 is possible. A surge past $0.90 will take FTM to $1.60.
It is good to buy on dips around $0.470 with SL around $0.390 for TP of $0.90.


