


 Trump has made more than $1 billion from crypto in a year. How?
  FxWirePro: GBP/NZD pulls back slightly , bullish bias persists.
  FxWirePro: GBP/USD gains some ground but outlook still bearish
  GBPJPY Weakens Amid Yen Strength: Sell on Rallies Recommended
  Michael Burry Shorts Tesla at $416 as AI and Semiconductor Bearish Bets Expand
  Economic pessimism has set in – but there are reasons for Australians to be hopeful
  Elon Musk is remaking the world, like Henry Ford before him – but more dangerously
  The government is ‘doubling down’ on its social media ban. But bigger penalties for platforms aren’t enough
  Vietnam’s population hit the 100 million milestone. Where’s it headed?


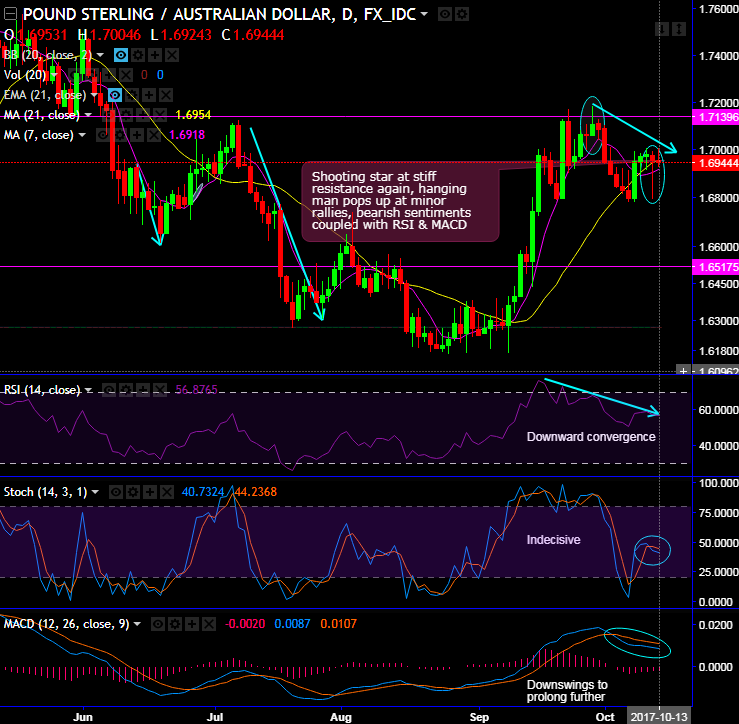
Historically, the stiff resistance zone is observed at 1.7130-50 mark.
The doji and shooting stars appear at the peaks of rallies at 1.7060 and 1.7107 levels respectively. Upon the occurrence of these bearish patterns, the downswings have occurred.
After a stern bullish rally in the previous month (see last month’s bullish engulfing pattern candle), the momentum is now seemingly hampered after the occurrence of these bearish patterns and unable to sustain at this supply zone.
Consequently, the bears managed to evidence price dips for the day that’s gone to test the support at 7DMAs. Expect more slumps on a decisive breach below this level and capitalizing on shrinking momentum is the wise move.
RSI oscillator shows downward convergence to indicate the bearish strength, while stochastic curves have been indecisive on daily terms, this leading oscillator has been attempting to pop up %d crossover to signal selling pressures.
On a broader perspective, we had stated in our recent post that “the major downtrend resume after failure swings below 38.2% Fibonacci retracements, every upswing is restrained below 7EMA”, the trend has exactly acted as per our whims and fancy (refer monthly chart for its bearish effects).
But for now, we call for most likely bullish engulfing candle pattern in this month’s candle with just one day to spare. Thereby, the major downtrend has been drifting in the consolidation phase since October 2016.
You could observe bulls on this timeframe have taken support at 23.6% Fibonacci level from the lows of 1.5665. Well, this pattern is not isolated but coupled with both RSI as well as stochastic curves’ bullish convergence to the consolidation phase. But MACD remaining bearish trajectory is yet to confirm this bullish indication.
Well, overall, we conclude by stating expect minor hic-ups in short run, while long-term traders wait for the better clarity.
Hence, we recommend shorting rallies on trade perspective and construct tunnel spreads.
At spot reference: 1.6956, contemplating lingering bearish indications, buy upper strikes at 1.7020 and sell lower strikes at 1.6910.
Currency Strength Index: FxWirePro's hourly GBP spot index has turned into 54 (which is bullish), while hourly AUD spot index was at shy above 77 (bullish) at 09:43 GMT. For more details on the index, please refer below weblink:


