


 FxWirePro: GBP/AUD drifts lower after BOE rate decision
  FxWirePro: EUR/ AUD dips below 1.6400 level, focus on near term support
  FxWirePro: GBP/USD rises as soft US data pressures dollar
  FxWirePro: USD/CNY downtrend loses steam, remains on bearish path
  NZDJPY Retreats on Yen Strength – Bearish Setup Targets 90 After Hitting 92.75 Low
  FxWirePro: AUD/USD gains some ground but outlook is bearish
  FxWirePro- Woodies pivot (Major)
  AUDJPY Volatile After Massive Sell-Off: Sell Rallies at 113, Targeting 110 as Bearish Momentum Surges
  FxWirePro- Major Pair levels and bias summary
  US Magnificent 7 Stocks Trend Score: Amazon & Microsoft Hit Extreme Bullish (+100) as Meta Drops to -100 — Key Resistance & Support Watchlist
  FxWirePro- Major Crypto levels and bias summary
  FxWirePro: USD/JPY dips as market assess risk of additional FX intervention.
  US Magnificent 7 Stocks Trend Score: Amazon & Microsoft Hit Extreme Bullish (+100) as Meta Drops to -100 — Key Resistance & Support Watchlist
  FxWirePro: NZD/USD consolidates overnight gains, but loses momentum
  JPY Currency Meter Signals: NZDJPY Bullish (+25) vs CHFJPY (-100) – These Pairs Could Move Next


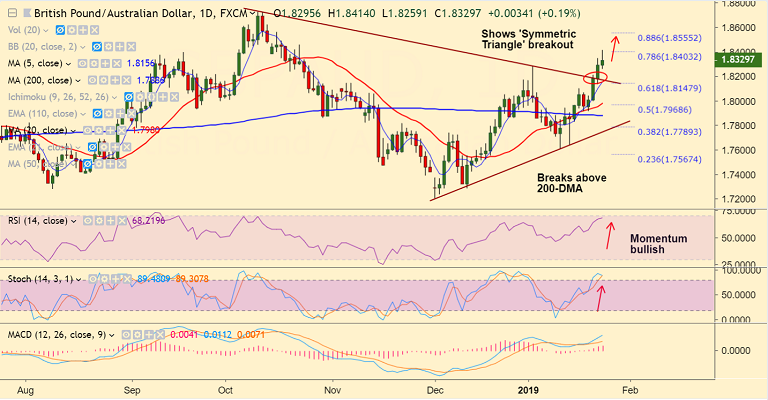
GBP/AUD chart on Trading View used for analysis
- GBP/AUD extends break above 200-W SMA, hits new 3-month highs at 1.8414.
- The pair has shown a breakout of 'Symmetric Triangle' pattern raising scope for further upside.
- Technical studies support upside. Volatility is also rising. We see next bull target at 88.6% Fib at 1.8555.
- On the weekly charts the pair has shown break above 200-W SMA. We see little resistance till Upper BB at 1.8602.
- On the flipside, retrace into Symmetric Triangle could see some weakness. Break below 200-DMA negates bullish bias.
Support levels - 1.8156 (5-DMA), 1.7980 (20-DMA)
Resistance levels - 1.84, 1.8555 (88.6% Fib), 1.8602 (Upper BB)
For details on FxWirePro's Currency Strength Index, visit http://www.fxwirepro.com/currencyindex.


