


 FxWirePro- Major European Indices
  FxWirePro: USD/JPY holding bid into weekend
  FxWirePro: EUR/CAD gains ground on prospects of resumed energy flows
  FxWirePro: EUR/AUD downtrend loses steam but outlook still bearish
  NZDJPY Bulls Charge Toward 95.00: Safe-Haven Exodus Drives Kiwi Rally
  FxWirePro: GBP/USD bulls remain cautiously optimistic
  FxWirePro- Woodies Pivot(Major)
  FxWirePro: USD/ZAR recovers slightly but trend is still bearish
  FxWirePro: GBP/AUD positions for another drop, eyes 1.8900level
  Ethereum Consolidates: Bullish Technicals Point to a Potential $3,000 Breakout
  Bitcoin’s Volatile Reset: ETFs Rebound as Bulls Eye USD 80,000 Milestone
  FxWirePro: AUD/USD retreats slightly but trend is still bullish
  FxWirePro: USD/ZAR edges lower ,investors remain on edge
  FxWirePro- Major Crypto levels and bias summary
  FxWirePro: USD/CAD recovers slightly but bearish outlook persists


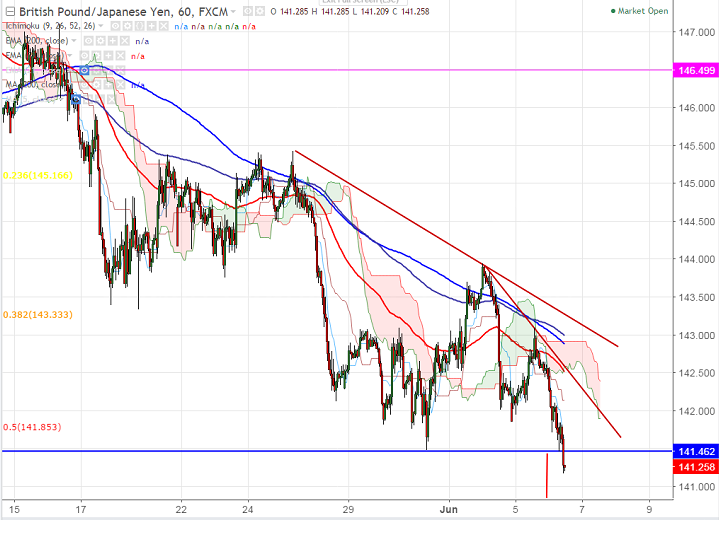
- GBP/JPY continues its losing streak after hitting high of 143.95 on Jun 2nd 2017. The pair broken temporary bottom around 141.48 on May 31st 2017. It is currently trading around 141.13.
- In the hourly chart the pair is trading well below Tenkan-Sen and Kijun-Sen and min or bullishness can be seen only above 142.28 (hourly Kijun-Sen). On the lower side, any break below temporary low confirms minor weakness, a decline till 140.37 (61.8% of 135.75 and 148.11)/138.50.
- The near term resistance is around 142.28 and any break above will take the pair till 143/143.95.
It is good to sell on rallies around 141.25-141.30 with SL around 142.05 for the TP of 140.37/139.
Resistance
R1-142.28
R2 -143
R3- 143.95
Support
S1-141.45
S2-140.37
S3-138.50


