


Long-legged doji occurs at 151.876 levels on intraday plotting (refer 2H chart)
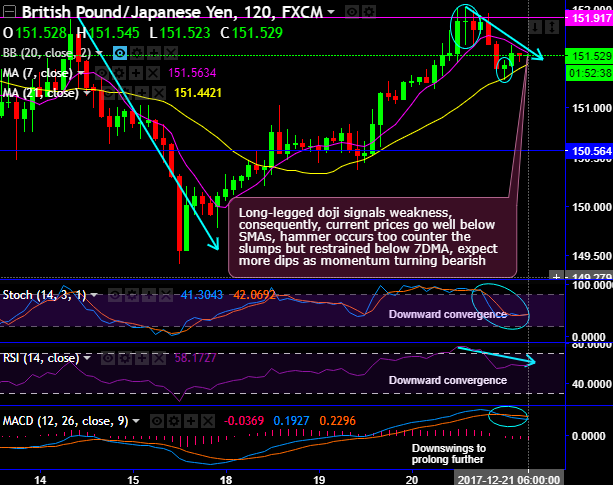
Ever since the occurrence of this bearish pattern, the price has dipped below 7SMA, subsequently, a hammer pattern occurs sensing support exactly at 21SMA to counter the slumps but restrained below 7DMA.
The stiff resistance at 151.917 is observed in the recent past, the failure swings have evidenced the steep slumps upto the lows of 149.414 levels.
But for now, long-legged doji signals weakness, consequently, the current prices go well below SMAs, expect more dips as momentum turning bearish.
The pair pops up hanging man at or near 38.2% Fibonacci retracement levels (at 152.208 levels) in the consolidation phase, ever since then the bulls seem to have given up their pace and showing weakness (refer monthly plotting).
The above-stated candle patterns are bearish in nature that hamper the previous bullish momentum in the consolidation phase of the major trend, if the sustenance below 38.2% level is observed then it is most likely to drag price slumps.
On a broader perspective, the stiff resistance is observed at 152.121 levels (i.e. 38.2% Fibonacci retracements). An in this consolidation phase, any breach below EMA levels is likely to drag slumps towards 145 levels. Although we see upward convergence, the buying momentum is shrinking away on both timeframes.
The stochastic oscillator on monthly terms has entered into overbought trajectory but has been indecisive.
While RSI on the 2H chart has been converging to the price drops to signal the strength in the selling interests. Whereas, monthly RSI (14) has been indecisive but trending below 61 levels that signal losing strength in the previous buying interests.
While MACD to substantiate bearish interests, signals extension of price dips on intraday terms.
Trade tips:
For an intraday speculation, we see the price to remain within the range between 151.775 and 151.267. Hence, we advocate buying boundary binaries using above levels as upper strikes and lower strikes, the trading between these strikes likely to derive certain yields in this puzzling trend and more importantly these yields are exponential from spot movements.
For cash or nothing, these options would be exercised if the forward prices to remain between both strikes (i.e. 151.775 > Fwd price > 151.267).
Currency Strength Index: FxWirePro's hourly GBP spot index is flashing -46 (which is bearish), while hourly JPY spot index was at -116 (which is bearish) while articulating (at 06:38 GMT). For more details on the index, please refer below weblink:
http://www.fxwirepro.com/currencyindex.
FxWirePro launches Absolute Return Managed Program. For more details, visit:


