


 Geopolitical Easing Fuels AUDJPY Rally Toward 115 — Buy Dips at 113
  Wall Street Analysts Weigh in on Latest NFP Data
  FxWirePro: EUR/AUD loses upside momentum but outlook is bullish
  FxWirePro: USD/ZAR edges higher, set to stay on back foot
  U.S. Banks Report Strong Q4 Profits Amid Investment Banking Surge
  Energy Sector Outlook 2025: AI's Role and Market Dynamics
  FxWirePro: GBP/AUD runs out of steam but maintains bullish outlook
  FxWirePro: GBP/AUD eases on Geopolitical whipsaw
  Indonesia Surprises Markets with Interest Rate Cut Amid Currency Pressure
  FxWirePro: USD/ CNY falls towards 6.750, bears keep the advantage
  FxWirePro- Major Crypto levels and bias summary
  U.S. Stocks vs. Bonds: Are Diverging Valuations Signaling a Shift?
  FxWirePro: USD/CAD steadies around 1.3990 ,retains bid one
  2025 Market Outlook: Key January Events to Watch


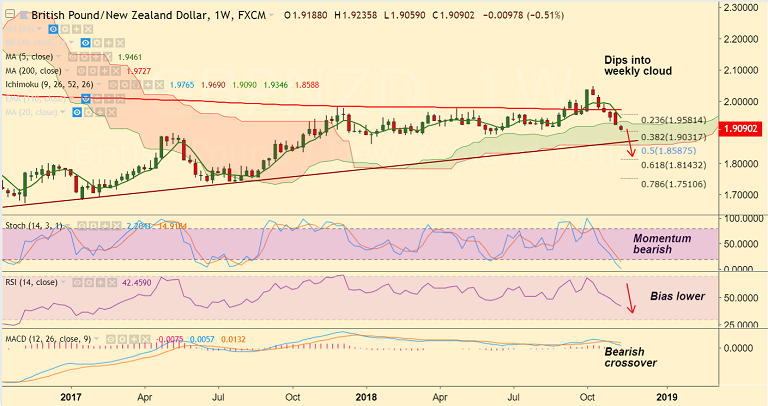
GBP/NZD chart on Trading View used for analysis
- GBP/NZD trades 0.35% lower on the day at 1.9080 at the time of writing.
- Price action has dipped below weekly cloud, is extending weakness for 6th straight week.
- Momentum studies bearish on weekly charts, RSI sharply lower and MACD shows bearish crossover.
- Technical analysis on daily charts is biased lower. Price action has slipped below 200-DMA and daily cloud.
- Focus on UK employment data due later in the day for fresh impetus. Quarterly Average Earnings for the UK, with Earnings plus bonuses for the annualized quarter into September expected to print at 3.0%, a tick healthier than the previous quarter's 2.7%.
- UK employment data for today could further derail GBP bulls if the numbers miss the mark.
- Price action hovers around 38.2% Fib at 1.9031. Break below eyes major trendline support at 1.8670.
- 5-DMA is immediate resistance at 1.9232. Bearish invalidation above 200-DMA.
Call update: Our previous call (https://www.econotimes.com/FxWirePro-GBP-NZD-Trade-Idea-1456491) has hit TP1.
Recommendation: Book partial profits at lows. Stay short for further weakness.
For details on FxWirePro's Currency Strength Index, visit http://www.fxwirepro.com/currencyindex.


