


 FxWirePro: USD/ZAR surges as rand slumps after SARB rate hold surprise
  FxWirePro- Woodies pivot (Major)
  FxWirePro: USD/CAD edges lower but bullish outlook persists
  FxWirePro: EUR/NZD firms after ECB holds rates steady at 2.25%
  FxWirePro: GBP/USD slips as middle east tensions and oil surge pressure pound
  FxWirePro- Major Crypto levels and bias summary
  Crypto Bias Report: Trend Signals and Top Bullish Picks
  FxWirePro: EUR/AUD neutral in the near term, scope for downward resumption
  AUDJPY Extends Four-Day Rally as Yen Weakness Fuels Fresh Buying Opportunity
  FxWirePro: USD/CNY edges higher but bulls lack punch
  NZDJPY Bullish Dip-Buy Setup: 93.60 Support Unlocks Path to 97
  JPY Action Bias: USDJPY, EURJPY, and CADJPY Emerge as Top Extremely Bullish Picks
  FxWirePro: GBP/NZD gains some ground but outlook is bearish
  NZDJPY Dips Create Fresh Buy Opportunity as Key Support Holds
  FxWirePro: GBP/AUD bears maintain upper hand
  Major Pairs Action Bias: USDCHF Emerges Extremely Bullish as EURUSD and GBPUSD Turn Deeply Bearish


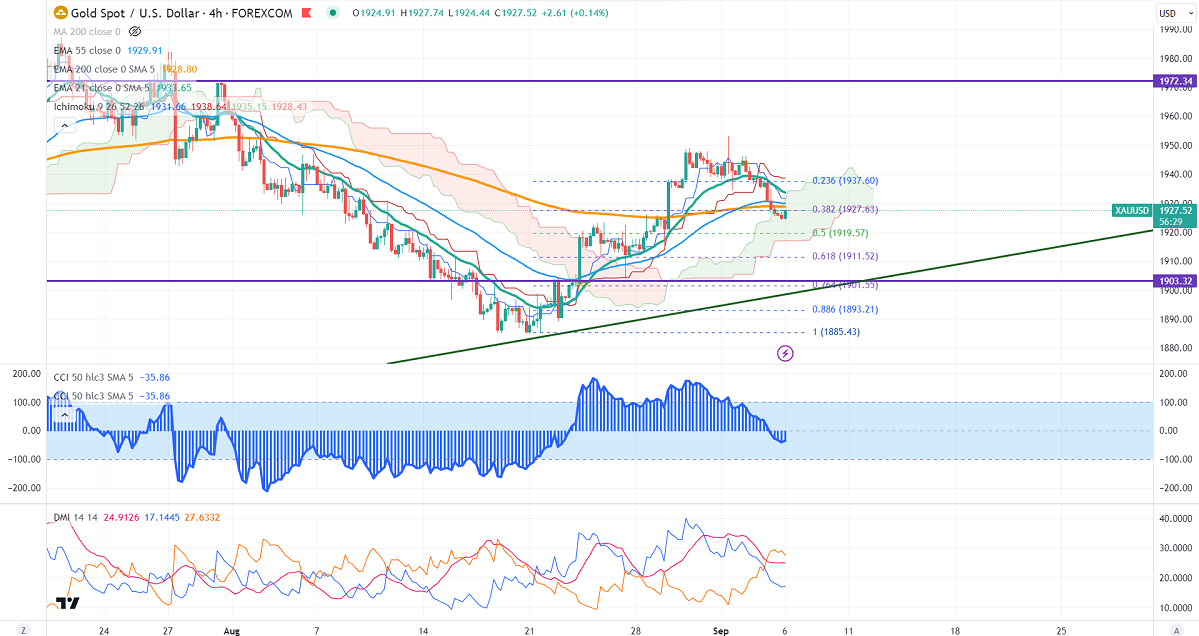
Ichimoku Analysis (4-hour chart)
Tenken-Sen- $1931.68
Kijun-Sen- $1938.64
Gold declined more than $10 yesterday on the strong US dollar. It has a low of $1924.27 and is currently trading around $1926.88.
Oil prices surged to 10- months as Saudi and Russia extended supply cuts. The jump of more than $3 in WTI crude oil yesterday will increase inflation worries and expectations of the central bank to hike rates remain high.
Major economic data for the week
Sep 6th, 2023, BOC rate statement (2:00 pm GMT)
US ISM services PMI
US dollar index- Bullish. Minor support around 103/102. The near-term resistance is 105/106.
According to the CME Fed watch tool, the probability of a no-rate hike in Sep increased to 93% from 86% a week ago.
The US 10-year yield showed a nice gap up in hopes of a further rate hike by the fed. Trades are flat due to the US labor market holiday. The US 10 and 2-year spread narrowed to -69% from -86.4%.
Factors to watch for gold price action-
Global stock market- mixed (neutral for gold)
US dollar index - Bullish (negative for gold)
US10-year bond yield- Bullish (negative for gold)
Technical:
The near–term support is around $1924, a break below targets of$1911/$1900. The yellow metal faces minor resistance around $1950 and a breach above will take it to the next level of $1970/$2000.
It is good to buy on dips around $1923-24 with SL around $1911 for TP of $1970/$2000.


