


 FxWirePro- Woodies pivot (Major)
  FxWirePro: USD/CNY dips as yuan firms on improving risk appetite
  FxWirePro: USD/CAD positions for another climb, eyes 1.4150 level
  FxWirePro :USD/JPY eases slightly, remains on bullish path
  FxWirePro: EUR/NZD downside pressure builds, key support level in focus
  FxWirePro- Woodies pivot (Major)
  FxWirePro: GBP/USD downtrend loses steam but outlook still bearish
  FxWirePro: GBP/NZD downside pressure builds, key support levels in focus
  GBPJPY Slips After Sterling Weakness, Bears Eye 216
  JPY Action Bias: Bullish Pairs to Watch Out For
  FxWirePro- Major Pair levels and bias summary
  FxWirePro: GBP/NZD gains some ground but bias is still bearish
  FxWirePro: GBP/AUD under pressure as pound continues to weaken
  BTC, ETH, SOL, XRP, and BNB: Major Crypto Pairs Stay Neutral
  FxWirePro: EUR/NZD up trend gains momentum but hurdles ahead


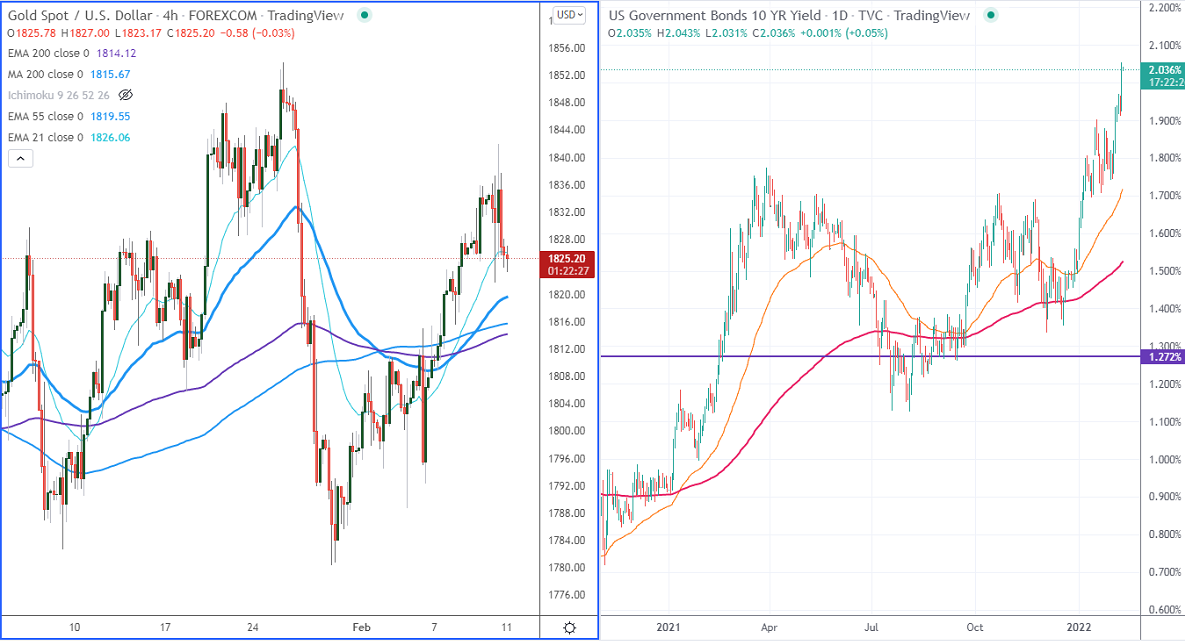
Ichimoku Analysis (4-Hour chart)
Tenken-Sen- $1830.79
Kijun-Sen- $1831.85
Gold lost more than $20 after upbeat US inflation numbers. The January US CPI came at 7.5% YoY vs forecast of 7.3%, the highest level since Feb 1982. US 10-year yield surges past 2% for the first time since Aug 2019. The US dollar index has formed double bottom around 95 and jumped more than 100 pips. Gold hits a low of $1821 and is currently trading around $1823.88.
Factors to watch for gold price action-
Global stock market- Bearish (positive for gold)
US dollar index –Bullish (negative for gold)
US10-year bond yield- Bullish (negative for gold)
Technical:
The near–term support is around $1820, violation below targets $1810/$1800/$1770/$1750. Significant reversal only below $1750.The yellow metal faces strong resistance of $1840, any violation above will take to the next level $1853/$1860/$1877/$1912 is possible.
It is good to sell on rallies for $1834-35 with SL around $1851 for TP of $1780.


