


 FxWirePro: USD/CAD edges lower but bullish outlook persists
  Major Pairs Bias: USDCHF Bullish While GBPUSD Turns Bearish
  AUDJPY Extends Four-Day Rally on Yen Weakness: Bullish Dip-Buy Eyes 117-118
  FxWirePro: AUD/USD uptrend loses steam, remains on bearish path
  EUR/USD Slides After ECB Hold, Bearish Technicals Favor Rally Fades
  FxWirePro:USD/JPY hovers near a four-decade low
  NZDJPY Bullish Dip-Buy Setup: 93.60 Support Unlocks Path to 97
  BTC, ETH, SOL, XRP, and BNB: Major Crypto Pairs Stay Neutral
  FxWirePro: GBP/NZD gains some ground but outlook is bearish
  NZDJPY Dips Create Fresh Buy Opportunity as Key Support Holds
  FxWirePro: USD/ZAR surges as rand slumps after SARB rate hold surprise
  FxWirePro: GBP/USD downtrend loses steam but outlook still bearish
  FxWirePro- Major Pair levels and bias summary
  JPY Action Bias: USDJPY, EURJPY, and CADJPY Emerge as Top Extremely Bullish Picks
  FxWirePro- Major Crypto levels and bias summary
  Major Pairs Action Bias: USDCHF Emerges Extremely Bullish as EURUSD and GBPUSD Turn Deeply Bearish
  FxWirePro- Major Crypto levels and bias summary


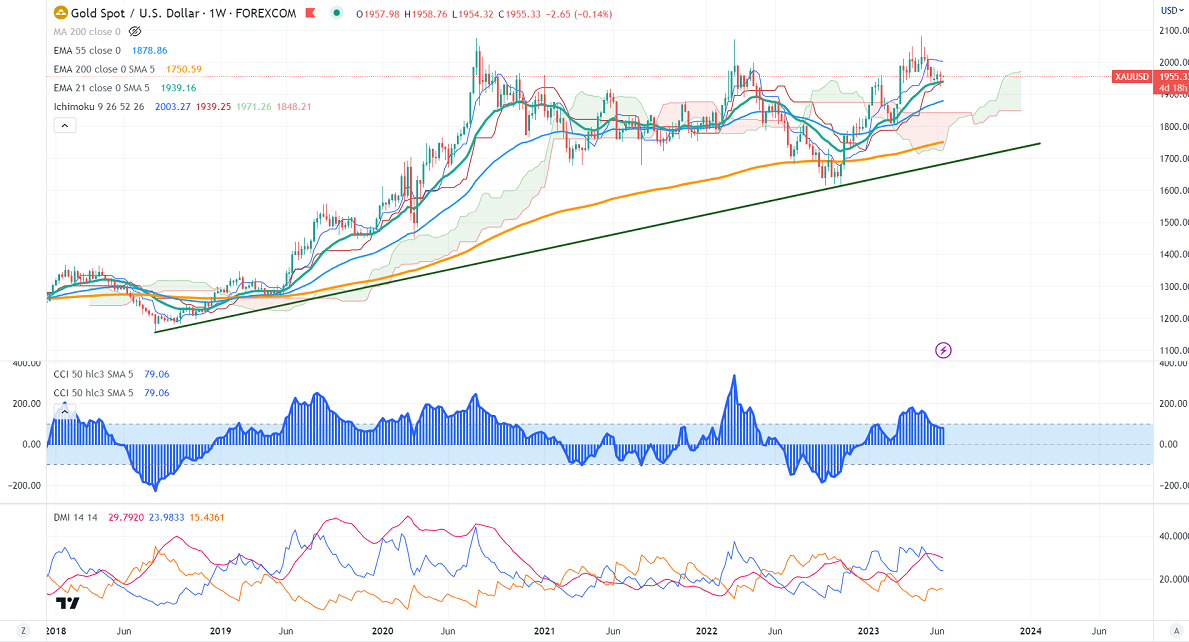
Ichimoku Analysis (Weekly chart)
Tenken-Sen- $2003.27
Kijun-Sen- $1932.90
Gold prices recovered sharply on Friday due to mixed US economic data. It hits a high of $1967.95 and is currently trading around $1955.59.
Major Central Bank policies-
ECB hiked rates by 25 bpbs to 3.50%, the highest level since 2001. The US Fed has kept its rates unchanged as expected at 5.25%. The central bank has projected the median federal funds rate from 5.1% to 5.6% (three more 25 bpbs rate hikes in 2023). For 2024 it increased from 4.3% to 4.6%.
US core CPI rose 4% in May from 4.9% in Apr, the lowest level since Mar 2021 in Apr. US May inflation rate at 0.10% (MoM) Vs. Est 0.30%.
US retail sales rose 0.30% in May, compared to an estimate of -0.20%. Core sales, excluding automobiles, gasoline, and building materials rose 0.20%. NY Fed Empire state manufacturing index jumps to 6.6 in June vs. -15.1 expected
US dollar index- weak. Minor support around 102/101. The near-term resistance is 103/103.85.
Major economic data for the week
Jun 21st, Fed Chairman Powell testifies (2 pm GMT)
SNB monetary policy Assessment (7:30 am GMT)
June 22nd, MPC official bank rate (11 am GMT)
US existing home sales (2 pm GMT)
June 23rd, Flash manufacturing PMI (1:45 pm GMT)
According to the CME Fed watch tool, the probability of a 25 bpbs rate hike in July increased to 71.9% from 52.8% a week ago.
The US 10-year yield pared some gains after mixed US economic data. The US 10 and 2-year spread widened to -94% from -35%.
Factors to watch for gold price action-
Global stock market- bullish (negative for gold)
US dollar index - Bearish (positive for gold)
US10-year bond yield- Bullish (Bearish for gold)
Technical:
The near–term support is around $1935, a break below targets of $1925/$1900.The yellow metal faces minor resistance around $1965, and a breach above will take it to the next level of $1980/$2000/$2020/$2040/$2070/$2100/$2150.
It is good to sell on rallies around $1960-61 with SL around $1975 for TP of $1920/$1900.


