


 Urban studies: Doing research when every city is different
  Wall Street Analysts Weigh in on Latest NFP Data
  U.S. Treasury Yields Expected to Decline Amid Cooling Economic Pressures
  Gold Prices Fall Amid Rate Jitters; Copper Steady as China Stimulus Eyed
  Mexico's Undervalued Equity Market Offers Long-Term Investment Potential
  Global Markets React to Strong U.S. Jobs Data and Rising Yields
  Lithium Market Poised for Recovery Amid Supply Cuts and Rising Demand
  Energy Sector Outlook 2025: AI's Role and Market Dynamics
  European Stocks Rally on Chinese Growth and Mining Merger Speculation
  US Futures Rise as Investors Eye Earnings, Inflation Data, and Wildfire Impacts
  UBS Predicts Potential Fed Rate Cut Amid Strong US Economic Data
  Indonesia Surprises Markets with Interest Rate Cut Amid Currency Pressure
  U.S. Banks Report Strong Q4 Profits Amid Investment Banking Surge
  U.S. Stocks vs. Bonds: Are Diverging Valuations Signaling a Shift?
  Moody's Upgrades Argentina's Credit Rating Amid Economic Reforms
  S&P 500 Relies on Tech for Growth in Q4 2024, Says Barclays
  Trump’s "Shock and Awe" Agenda: Executive Orders from Day One


As for the Indian rupee (INR), its steep 5% depreciation in August has eroded all of the gains made in the first five months of the year. Just yesterday, INR treaded new YTD lows against the greenback, with USD/INR already past our year-end forecast of 72.00. The Indian currency has weakened sharply since the start of the month amid general pressure on EM Asia currencies amid CNY's surprise depreciation beyond 7.00, the re-escalation of the US-China trade war, as well as tensions with Pakistan. While the main catalysts have largely been external, domestic factors still do not provide a compelling case to expect any sustained recovery in INR at the moment. The general backdrop is still of one of slowing growth and monetary policy easing by RBI amid an uncertain global environment.
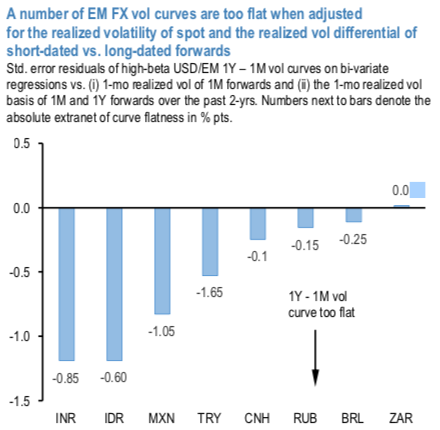
Flatter EM vol curves are not a complete anomaly amid risk market weakness however, since the dynamics of front-end vols matter and matter greatly for term structure shapes. Indeed, the realized vol basis between forwards of different maturities as noted above is very much a second order effect in vol curve modelling over long histories.
Accordingly, the 1st chart displays regression residuals of 1Y- 1M vol curves adjusting for both the absolute level of realized vol as well as the vol basis between long- and short-end forwards. On this metric, vol curves in the Asian high-yielders INR and IDR screen as the flattest, followed by MXN and TRY (all 0.8-1 s.e. dislocated). Two comments about these results are worth making.
First, curve flatness in any high-yielding currency pair is more jarring than otherwise, since all such vol surfaces should have a natural upward gradient to compensate for the level- of-carry / forward point based appeal of owning long-dated options.
Absent such a slope, the static carry of the USD put/EM call leg of ATMF straddles may prove so large relative to the cost of the straddles themselves (USD call and USD put together) that carry/premium ratios can explode and render straddle (i.e. vol) ownership super- normally attractive. While it is not uncommon for static carry / premium ratios of USD/EM ATMF straddles to exceed 1 i.e. for straddle ownership to be "carry-free" on an ex-ante static basis – a perversity of sorts in its own right – and while there is no mathematical cap on them as such, it is rare for such ratios to expand indefinitely without encountering vol buying demand that raises option prices and reverts them back to something closer to normal.
Second, it is not surprising to see Asian names at the top of the list, since back-end Vega supply is typically more predominant among Asian corporates than elsewhere in EM. For both INR and IDR in particular, the supply of long-dated ATM vol and risk-reversals from corporate hedging flow has been a well-known structural feature of FX option markets in the post- GFC era. While it is difficult to have any visibility on when such flows might abate, it is more straightforward to assert that -
a) USD/INR 1Y ATM vol at 7.0 is depressed by any historical yardstick;
b) India macro has deteriorated sharply in a way that challenges sanguine ownership of INR carry; and
c) that the flatness of the curve affords an opportunity to value investors to enter into theta-friendly long vol trades via 6M6M forward volatility (FVA mid @ 6.6 vis-a-vis 6M ATM vol @ 6.9 at the time of going to print) or vanilla equivalents (-6M/+1Y gamma-neutral straddle calendars) in the flattest section of the vol surface (refer 2nd chart). Courtesy: JPM


