


 Gold Prices Fall Amid Rate Jitters; Copper Steady as China Stimulus Eyed
  How Donald Trump has changed the way diplomacy is done
  U.S. Banks Report Strong Q4 Profits Amid Investment Banking Surge
  With Iran and the US signing a peace deal, where does that leave Benjamin Netanyahu?
  Goldman Sachs: US Dollar Likely to Stay Strong Despite Oil Price Retreat
  Today’s space race could turn fatal if we don’t agree on new rules
  US Gas Market Poised for Supercycle: Bernstein Analysts
  UBS Predicts Potential Fed Rate Cut Amid Strong US Economic Data
  Wall Street Analysts Weigh in on Latest NFP Data
  U.S. Stocks vs. Bonds: Are Diverging Valuations Signaling a Shift?
  Geopolitical Shocks That Could Reshape Financial Markets in 2025
  Sell the Bounce": Gold Rally Stalls Near $4165 as Fed Hawks Slam the Door on Rate Cuts — Targets $4000/$3600
  How AI prompting turned writerly description into an everyday skill


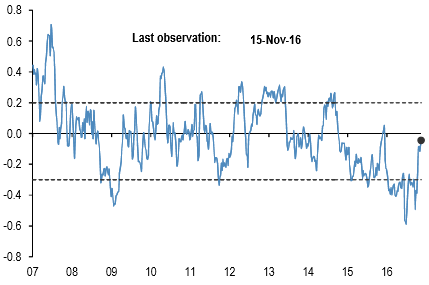
The difference between net spec positions on risky & safe currencies
Net spec position is calculated in USD across 5 "risky" and 3 "safe" currencies (safe currencies also include Gold).
These positions are then scaled by open interest and we take an average of "risky" and "safe" assets to create two series.
The above chart is then the simply the difference between the "risky" and "safe" series. The final series shown in the chart is demeaned using data since 2006. The risky currencies are: AUD, NZD, CAD, RUB, MXN, and BRL. The safe currencies are: JPY, CHF, and Gold.
You could probably understand why we are stating this by referring the above nutshell evidencing delta risk reversal. JPY, CHF and XAU crosses against the dollar have negative flashes which would mean that these currencies have safe proportions in hedging arrangements, whereas rest dollar crosses show positive risk reversal which means that bearish pressures are intensifying in these counterparts of the dollar.
Net spec positions are the number of long contracts minus the number of short using CFTC futures only data. This net position is then converted to a USD amount by multiplying by the contract size and then the corresponding futures price.
To proxy for speculative investors, for commodity positions we use the managed money category, for equity positions we use Leveraged funds and Asset managers, whereas other assets use the legacy non-commercial category.
We then scale the net positions by open interest. The chart shows the z-score of these net positions, i.e. the current net position divided by the open interest, minus the average over the whole sample divided by the standard deviation of the weekly positions over the whole sample.
US rate is a duration-weighted composite of the individual UST series excluding the Eurodollar contract. UK ICE Brent positions are with one week lag. The sample starts on the 13th of June 2006.


