


 China's Refining Industry Faces Major Shakeup Amid Challenges
  Oil Prices Dip Slightly Amid Focus on Russian Sanctions and U.S. Inflation Data
  Indonesia Surprises Markets with Interest Rate Cut Amid Currency Pressure
  US Gas Market Poised for Supercycle: Bernstein Analysts
  Urban studies: Doing research when every city is different
  Trump’s "Shock and Awe" Agenda: Executive Orders from Day One
  Gold Prices Fall Amid Rate Jitters; Copper Steady as China Stimulus Eyed
  2025 Market Outlook: Key January Events to Watch
  J.P. Morgan Sees Potential Vestas Guidance Upgrade Amid Strong Wind Energy Demand
  SpaceX Stock Gets $175 Target as Analysts See Massive Growth Ahead
  AI Memory Boom Sparks Global Chip Supply Crunch
  S&P 500 Relies on Tech for Growth in Q4 2024, Says Barclays


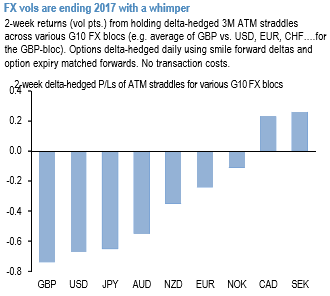
Despite a packed week of central bank meetings and data releases, 2017 the trading year is going out rather quietly into the night as far as FX vol markets are concerned. Fireworks of last December are conspicuous by their absence this time around, with any chance of a last hurrah for the dollar in a rather forgettable year dashed by no changes to the FOMC’s plan of three unhurried hikes amid strong, non-inflationary growth in 2018. VXY has once again collapsed to the lows of the year with Fed risks out of the way and the holiday season in sight and delta-hedged returns over the past 2-weeks across various G10 FX blocs have been in the red with the exceptions of CAD - (oil-related whipsaw) and SEK - (post-CPI beat gyrations) crosses (refer above chart).
In buying a DNT, an investor is looking to get some leverage in selling volatility that the market is supposed to be overestimating. We now turn to market volatility indicators. The first considers only ATM volatility in order to identify expensive implied volatilities in the same way as the options market, namely by comparing implied volatility to realized volatility.
While few other indicators provide a refined understanding of spot dynamics, the volatility risk premium compares the options market pricing to the spot dynamics. This indicator can be particularly useful for selecting rich expiries in the volatility term structure.
Selecting the same tenor for the implied and realized volatility is not the most efficient way to assess implied volatilities. Long-term realized volatilities are relatively insightful since the market tends to have a short-term memory, even for long tenors. Indeed, most of the volatility risk is integrated into the front end of the curve and is then more or less propagated towards the longer expires. In the same fashion, very-short-term volatilities are naturally unstable and are essentially useful for gamma trading. Empirically, we observe that the 3m realized volatility is the best sampling period for explaining implied volatilities all along the curve.
Volatility risk premia tend to be larger in EM than G10 vols (refer above graph), which reflects that emerging currencies support higher tail risk.
The previous indicator is helpful to discriminate tenors in the implied volatility term structure. But the DNT also crucially depends on the volatility smile. As the payoff depends on spot deviations either way towards the two bounds, the pricing is strongly influenced by the OTM implied volatilities of both calls and puts: a DNT is more likely to be knocked out when large moves are more likely. If the options market is strongly pricing tail risks, the DNT will be cheaper.
This happens when the volatility smile is very convex (high OTM implied volatilities), which for FX options means that butterflies are high. By definition, butterflies already compare OTM volatilities to the ATM volatility (this strategy can be deconstructed as a long strangle and short straddle), so we can directly assume that a DNT will be more attractively priced when butterflies are expensive.
To assess the value of butterflies, we look at how high their percentiles are compared to volatility percentiles (refer above graph). This allows us to see how the options market perceives tail risk compared to standard risk and to identify the currency pairs where there is a special tail premium. Courtesy: SG


