


 Gold Prices Fall Amid Rate Jitters; Copper Steady as China Stimulus Eyed
  FxWirePro: Daily Commodity Tracker - 21st March, 2022


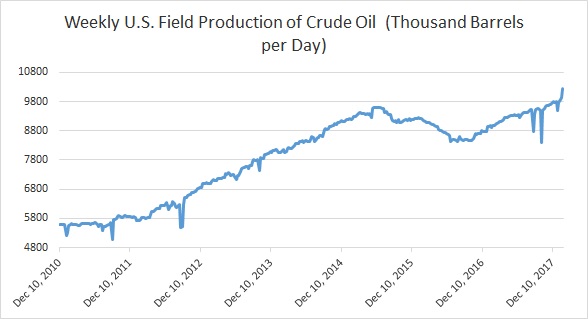
Here are some key charts based on data from United States’ Energy Information Agency (EIA) that explains the level of inventories, refinery demand, and production.
- Chart 1 shows crude oil production in the United States which has reached an all-time high last year, rose sharply to 10.251 million barrels per day last week compared to 9.92 million barrels per day in the week before.
- Chart 2 has been making the refiners around the world cheer and filling OPEC with joy as it shows that distillate inventories have declined significantly and fallen to the 5-year average. However, it has been rising over the past few weeks. However, last week, it rose again to 141.82 million barrels.
- U.S. oil imports have been declining over the past couple of year. However, Chart 3 shows that imports declined last week to 7.89 million barrels per day.
- Chart 4 shows the level of U.S. crude oil exports, which has fallen from a record high of 2.113 million barrels per day. Last week export was 1.287 million barrels per day.
- Chart 5 shows U.S. refinery operating at 92.5 percent capacity.
- Chart 6 shows the level of crude oil inventories, which has declined around 112 million barrels since March 2017. However, inventories have risen for a third consecutive week to 420.25 million barrels.
FxWirePro launches Absolute Return Managed Program. For more details, visit http://www.fxwirepro.com/invest


