


 FxWirePro- Major Crypto levels and bias summary
  FxWirePro- Major Crypto levels and bias summary


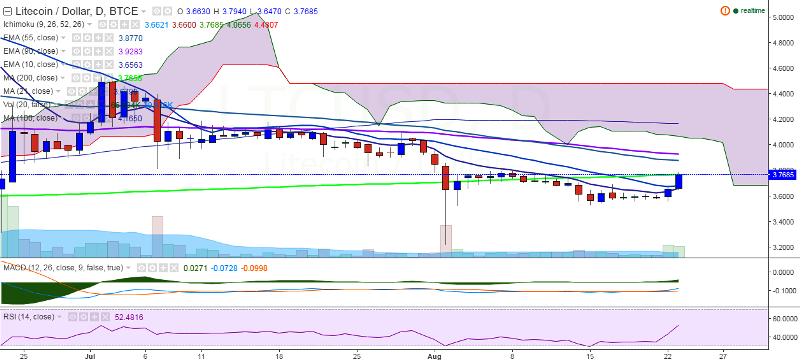
LTC/USD traded strong on Tuesday and briefly broke above 200-day MA. It continues to hover around this major trend line and is trading at 3.74 levels at the time of writing (BTC-e).
Ichimoku analysis of daily chart:
Tenkan Sen: 3.61
Kijun Sen: 3.66
Trend reversal: 3.76 (200-day MA)
LTC/USD is going strong on the back of newly found momentum. On the upside, a consistent break above 3.76 (200 DMA) would confirm bullishness and take the pair to 3.93 (90 EMA)/4.16 (100-day MA). On the other hand, immediate support is seen at 3.50 levels and a break below would target 3.22 (August 2 low)/3.00.

- News

- Economy

- Central Banks
- Investing
- Research
- Roundups
- Digital Currency
- Insights
- Technical Analysis
- Technology
- Business
- Law
- Health
- Nature
- Fintech
- Science
- Topic
- Opinions
- ©Econometrics LLC . All Rights Reserved.
FxWirePro: LTC/USD trades higher, good to buy on dips
Tuesday, August 23, 2016 10:37 AM UTC
Editor's Picks


- Market Data
Most Popular


