


 Bitcoin's Tug-of-War: Bulls Eye 80,000 USD Despite Turbulent ETF Outflows
  Euro Ascendant: EUR/USD Breaks $1.17 as Geopolitical Relief Sparks a Bullish Surge
  Aussie Bulls Charge: AUD/JPY Rallies as Geopolitical Clouds Part
  FxWirePro: GBP/USD stuck in range but maintains bearish bias
  FxWirePro- Major European Indices
  FxWirePro- Major Pair levels and bias summary
  Pound Sterling Power: GBP/JPY Secures Third Day of Gains as Global Risk Tensions Recede
  FxWirePro: USD/CNY falls to three-year high, scope for further downside
  FxWirePro: AUD/USD spikes as Trump announces two-week Iran ceasefire
  FxWirePro: GBP/NZD reverses course, bias back to downside
  NZDJPY Bearish Breakdown: Why Selling the Rallies is the Strategic Play
  FxWirePro: USD/ JPY slips as yen rallies after Mideast ceasefire declaration
  Ethereum Braces for Volatility: Technicals Turn Bearish as Geopolitical Tensions Loom
  FxWirePro- Major Crypto levels and bias summary
  FxWirePro: GBP/AUD downtrend extends, eyes 1.8900 evel
  FxWirePro- Major European Indices


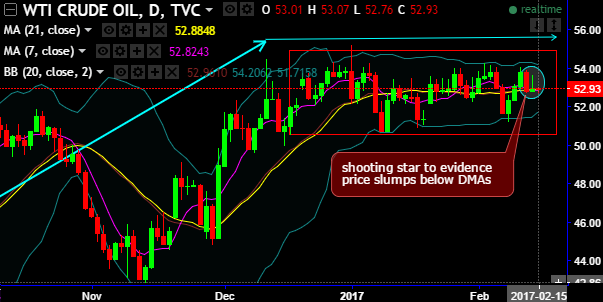
On daily terms, the shooting star is traced out at 53.01 levels to evidence the price slumps below DMAs.
On weekly terms, spinning top and doji are occurred at 53.67 and 53.15 levels respectively.
Well, for now, interim dips seem to be on cards as spinning top and long legged doji appear in whipsaws pattern after the uptrend.
Bulls seem to have exhausted at resistance at 54.31 to 55 levels, more price dips seems to be on cards as the current prices attempt to slide below 7SMA.
You could very well observe the divergence between price curve & RSI, as a result, we foresee downswings may extend to retest support at around 50.5467 levels. The other leading oscillator (stochastic) has been indecisive but bearish bias by signaling overbought pressures.
On the contrary, as stated in our previous post we’ve been still firm on bullish targets in medium-long run, WTI crude price has been spiking higher through ascending triangle (monthly chart) showing strength in rallies after the formation of dragonfly doji on monthly plotting.
RSI evidences the upward convergence to the price spikes on this timeframe. While stochastic curves have been indecisive but bullish bias.
To substantiate this bullish stance, weekly MACD signals upswings to extend further.
Oil prices plummeted on Wednesday over concerns that producer club OPEC would not be able to maintain its high compliance so far with output cuts aimed at reining in a global fuel supply overhang.
Oil prices slid below 53 levels in Asia on Wednesday ahead of the market shrugging off a much larger than expected build in U.S. inventories reported by an industry group.


