


 UBS Predicts Potential Fed Rate Cut Amid Strong US Economic Data
  FxWirePro: GBP/AUD steadies around 0.9145 ,retains bid tone
  Urban studies: Doing research when every city is different
  FxWirePro: USD/CAD hits 14-month high , Scope for further upside
  AUDJPY Breaks Key Trendline Support — Bears Eye 110 as Momentum Accelerates
  AUDJPY Bears Take a Breather at 111.50, But ‘Sell on Rallies’ Still Eyes 110
  UBS Projects Mixed Market Outlook for 2025 Amid Trump Policy Uncertainty
  FxWirePro: GBP/AUD sustains gains as uptrend remains strong
  Gold Prices Slide as Rate Cut Prospects Diminish; Copper Gains on China Stimulus Hopes
  European Stocks Rally on Chinese Growth and Mining Merger Speculation
  U.S. Banks Report Strong Q4 Profits Amid Investment Banking Surge
  Energy Sector Outlook 2025: AI's Role and Market Dynamics
  FxWirePro: NZD/USD downside pressure builds, key support level in focus
  FxWirePro- Major Pair levels and bias summary
  EURJPY Bounce Loses Steam Below 184 — Sell-the-Rally Setup Eyes 183 Target
  FxWirePro: USD/JPY edges higher as the yen remains vulnerable despite repeated warnings of intervention.


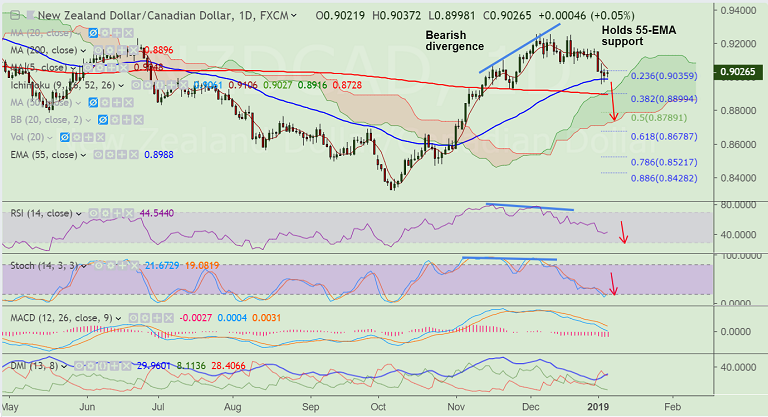
NZD/CAD chart on Trading View used for analysis
- NZD/CAD extends range trade at 55-EMA support.
- Positive news related to the US-China trade war alongside China's announcement of more stimulus measures coming from the banking sector support antipodeans.
- Back-to-back spinning top formations suggest lack of direction.
- Price action has slipped below 21-EMA support and bearish divergence on RSI and Stochs keeps bearish bias.
- Upside lacks traction, doji formation seen on daily candle. Immediate resistance lies at 5-DMA. Break above to see minor upside.
- Break below 55-EMA to see dip till next bear target at 200-DMA at 0.89. Violation there will see test of 61.8% Fib at 0.8678.
Support levels - 0.8988 (55-EMA), 0.89 (converged 200-DMA and 38.2% Fib), 0.8789 (50% Fib), 0.8678 (61.8% Fib)
Resistance levels - 0.9048 (5-DMA), 0.9087 (21-EMA), 0.92, 0.9256 (Dec high)


