
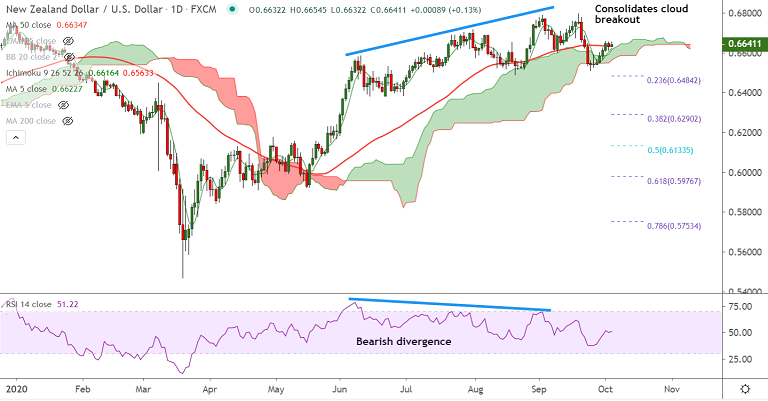
NZD/USD chart - Trading View
Technical Analysis: Bias Neutral
GMMA Indicator
- Neutral bias on the GMMA for minor and major trend on the daily and weekly charts
Ichimoku Analysis
- Price action is above cloud on the weekly and daily charts
- Chikou Span has gone flat as price action consolidates above daily cloud
- Daily Tenkan Sen: 0.6584
- Daily Kijun Sen: 0.6654
Oscillators
- RSI is flat, just above the 50 mark, while stochs are biased higher
- Momentum has turned bearish on the weekly charts after upside was rejected at 200W MA resistance
Bollinger Bands
- Bollinger bands are wide suggesting high volatility
Major Support Levels: 0.6604 (55-EMA), 0.6525 (110-EMA)
Major Resistance Levels: 0.6642 (20-DMA), 0.6774 (200W MA)
Summary: NZD/USD is expected to trade in the 0.6525-0.6775 range in the near term. Decisive breakout at 200W MA will buoy prices higher. Focus on FOMC minutes due this Wednesday for further impetus.


