


 FxWirePro: GBP/NZD remains weak, eyes 38.2%fib support
  FxWirePro: GBP/USD rises as soft US data pressures dollar
  FxWirePro: USD/CNY dips to hit three year low,scope for further downside
  FxWirePro: USD/CAD retreats after Canada posts stronger-than-expected GDP growth
  US Magnificent 7 Stocks Trend Score: Amazon & Microsoft Hit Extreme Bullish (+100) as Meta Drops to -100 — Key Resistance & Support Watchlist
  FxWirePro: AUD/USD cedes early gains ,outlook bearish
  FxWirePro: USD/ZAR gains as stronger dollar outweighs upbeat South Africa's trade surplus
  Nikkei Surges Past 65,000 on Suspected Yen Weakness: Tech Giants Like Advantest and NEC Lead Explosive Gains
  FxWirePro- Major Pair levels and bias summary
  All Major JPY Pairs Hit Extreme Bearish Score of -100: USDJPY, EURJPY, GBPJPY, AUDJPY, NZDJPY & CADJPY Flash Maximum Weakness
  US Magnificent 7 Stocks Trend Score: Amazon & Microsoft Hit Extreme Bullish (+100) as Meta Drops to -100 — Key Resistance & Support Watchlist
  FxWirePro: GBP/NZD remains weak, eyes 38.2%fib support
  FxWirePro: GBP/AUD drifts lower after BOE rate decision
  FxWirePro: USD/JPY dips as market assess risk of additional FX intervention.
  FxWirePro: AUD/USD gains some ground but outlook is bearish
  FxWirePro: GBP/AUD bears maintain upper hand
  FxWirePro:USD/JPY climbs back above 160.00 after BOJ rate decision


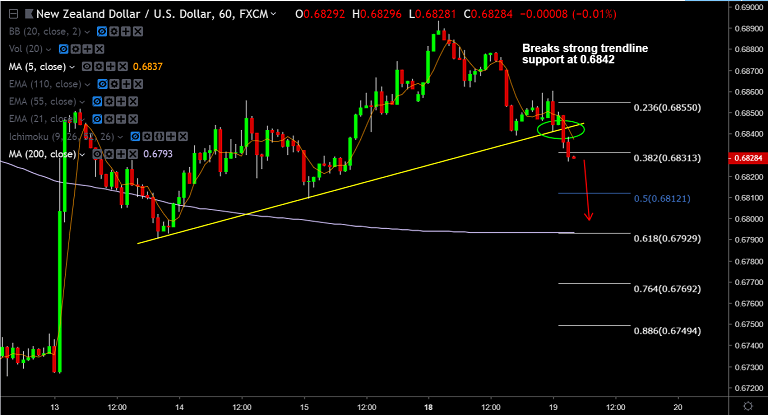
NZD/USD chart on Trading View used for analysis
NZD/USD Technical Analysis (1H chart):
- Evening Star formation on daily charts
- Price action breaks below major trendline support at 0.6842
- Price has dipped below 1H 110-EMA at 0.6834
- MACD is on verge of bearish crossover on signal line
Fundamental Analysis:
- Cautious tone prevails across the Asian markets amid reports of another round of US-China trade talks
- FOMC meeting minutes will be looked upon for clues over the Fed's rate hike path for 2019
- Focus also on GDT price auction for further impetus
Support levels - 0.6812 (50% Fib), 0.6792 (converged 1H 200-SMA and 61.8% Fib)
Resistance levels - 0.6838 (1H 5-SMA), 0.6860 (session high), 0.6893 (Feb 18 high)
Recommendation: Stay short around 0.6835/40, SL: 0.6860, TP: 0.6812/ 0.6790
For details on FxWirePro's Currency Strength Index, visit http://www.fxwirepro.com/currencyindex.

- News

- Economy

- Central Banks
- Investing
- Research
- Roundups
- Digital Currency
- Insights
- Technical Analysis
- Technology
- Business
- Law
- Health
- Nature
- Fintech
- Science
- Topic
- Opinions
- ©Econometrics LLC . All Rights Reserved.
FxWirePro: NZD/USD Trade Idea
Tuesday, February 19, 2019 4:31 AM UTC
Editor's Picks


- Market Data
Most Popular


