


 Major Pairs Action Bias: USDCAD and USDCHF Stand Out as Extremely Bullish While GBPUSD and NZDUSD Turn Extremely Bearish
  FxWirePro- Major Pair levels and bias summary
  FxWirePro: USD/ZAR uptrend loses steam, remains on bullish path
  FxWirePro- Major Pair levels and bias summary
  FxWirePro: NZD/USD edges lower, remains on back foot
  FxWirePro: USD/CAD gaining momentum for a move towards 1.4200 level
  FxWirePro: GBP/NZD gains some ground but bias is still bearish
  FxWirePro: USD/CAD runs out of steam but maintains bullish outlook
  Crypto Action Bias: ETHUSD Stands Out as the Bullish Pair to Watch
  FxWirePro: EUR/NZD up trend gains momentum but hurdles ahead
  NZDJPY Pullback: Sell Rallies Toward 93.30 as Yen Weakness Eases
  FxWirePro- Major Crypto levels and bias summary
  FxWirePro: GBP/USD edges higher as traders await BoE guidance and UK fiscal clarity
  FxWirePro: USD/ZAR retreats but trend is still bullish
  EUR/JPY Holds Bullish Bias as Euro Extends Recovery
  FxWirePro: GBP/NZD maintains bersish bias with focus on 2.2900 level


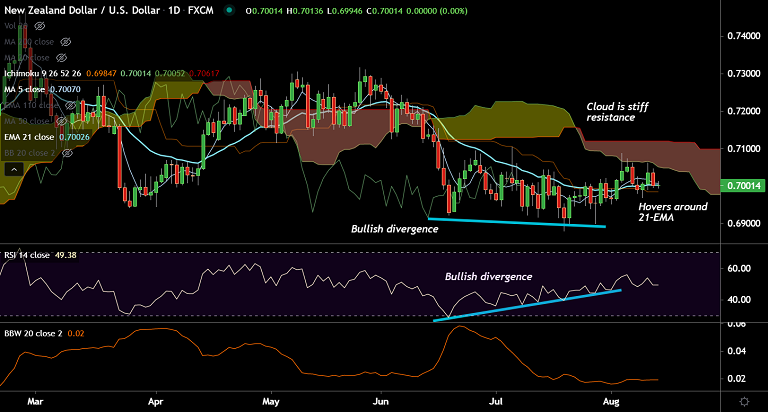
NZD/USD chart - Trading View
Spot Analysis:
NZD/USD was trading in narrow range at 0.70 at 06:25 GMT
Previous Week's High/ Low: 0.7088/ 0.6952
Previous Session's High/ Low: 0.7047/ 0.6995
Fundamental Overview:
Focus is on the Reserve Bank of New Zealand (RBNZ) policy meeting next week to provide the pair a meaningful direction.
The pair has been extending sideways grind and kiwi bulls hope for a rate rise next week and the promise of more to break out.
The RBNZ's last hike of 50 basis points was in May 2000. A rise of 25 basis points to 0.5% on August 18th is now fully priced in.
A hawkish surprise is what can provide some significant price moves.
Technical Analysis:
- GMMA indicator shows major trend is bearish, while minor trend is neutral
- Price action is below cloud and some major moving averages
- Bullish divergence on RSI on the daily charts keeps scope for upside
- Death Cross (bearish 50-DMA crossover on 200-DMA) could limit gains
Major Support and Resistance Levels:
Support - 0.6957 (55-week EMA), Resistance - 0.7105 (200-DMA)
Summary: NZD/USD trades pivotal at cloud resistance and 55-week EMA support. RBNZ policy meet next week will be in focus for clear direction.


