


 Major European Indices Score Extremely Bullish: DAX Eyes 26000, CAC Targets 8600, FTSE100 at 11000 – Key Levels to Watch
  FxWirePro- Major Crypto levels and bias summary
  Moldova Criticizes Russia Amid Transdniestria Energy Crisis
  Global Markets React to Strong U.S. Jobs Data and Rising Yields
  Gold Prices Fall Amid Rate Jitters; Copper Steady as China Stimulus Eyed
  2025 Market Outlook: Key January Events to Watch
  U.S. Banks Report Strong Q4 Profits Amid Investment Banking Surge
  Mexico's Undervalued Equity Market Offers Long-Term Investment Potential
  FxWirePro: NZD/USD firms as Kiwi gains on strong ANZ business outlook data
  U.S. Treasury Yields Expected to Decline Amid Cooling Economic Pressures
  Oil Prices Dip Slightly Amid Focus on Russian Sanctions and U.S. Inflation Data
  Stock Futures Dip as Investors Await Key Payrolls Data
  Urban studies: Doing research when every city is different
  Lithium Market Poised for Recovery Amid Supply Cuts and Rising Demand
  Bank of America Posts Strong Q4 2024 Results, Shares Rise
  Nikkei Surges Past 65,000 on Suspected Yen Weakness: Tech Giants Like Advantest and NEC Lead Explosive Gains


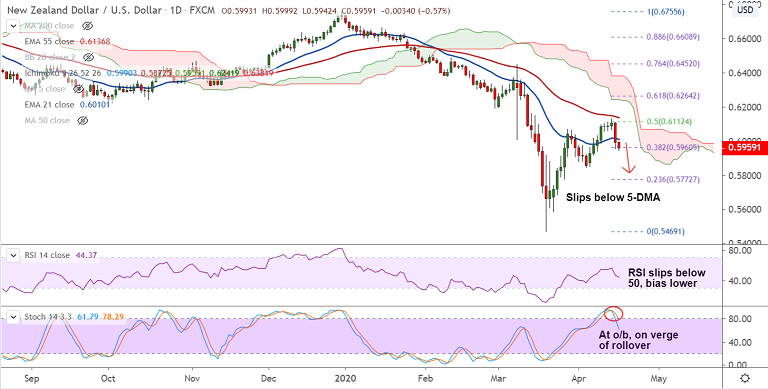
NZD/USD chart - Trading View
NZD/USD is extending weakness for the 2nd straight session, bias is turning bearish.
The pair was trading 0.52% lower on the day at 0.5965 at around 06:40 GMT.
Price action has slipped below 21-EMA support, technical studies are turning bearish.
Major and minor trend as evidenced by GMMA indicator are bearish. Price action has slipped below 200H MA.
Fears of impending global recession and the resultant haven demand for the US dollar keeps downside pressure.
Technical studies are poised for bearish reversal. Stochs are on verge of rollover from overbought levels.
Upside capped below 0.60 handle. Bears eye April lows at 0.5843. Next major support aligns at 23.6% Fib at 0.5772.
Support levels - 0.5949 (20-DMA), 0.5872 (Kijun Sen), 0.5772 (23.6% Fib)
Resistance levels - 0.6010 (21-EMA), 0.6047 (5-DMA), 0.6136 (55-EMA)


