


 FxWirePro- Major Pair levels and bias summary
  NZDJPY Bears Stay in Command: Sell Rallies at 92.72-75 Targeting 90 as All EMAs Flash Red
  FxWirePro: USD/JPY dips as market assess risk of additional FX intervention.
  FxWirePro: EUR/ AUD dips below 1.6400 level, focus on near term support
  FxWirePro: GBP/AUD bears maintain upper hand
  All Major JPY Pairs Hit Extreme Bearish Score of -100: USDJPY, EURJPY, GBPJPY, AUDJPY, NZDJPY & CADJPY Flash Maximum Weakness
  FxWirePro- Major Pair levels and bias summary
  NZDJPY Retreats on Yen Strength – Bearish Setup Targets 90 After Hitting 92.75 Low
  FxWirePro- Major Crypto levels and bias summary
  FxWirePro: USD/CNY dips to hit three year low,scope for further downside
  FxWirePro: USD/CAD retreats after Canada posts stronger-than-expected GDP growth
  FxWirePro: GBP/AUD drifts lower after BOE rate decision
  FxWirePro: USD/ZAR gains as stronger dollar outweighs upbeat South Africa's trade surplus
  FxWirePro: GBP/NZD remains weak, eyes 38.2%fib support
  FxWirePro: GBP/NZD remains weak, eyes 38.2%fib support
  AUDJPY Volatile After Massive Sell-Off: Sell Rallies at 113, Targeting 110 as Bearish Momentum Surges
  Nikkei Surges Past 65,000 on Suspected Yen Weakness: Tech Giants Like Advantest and NEC Lead Explosive Gains


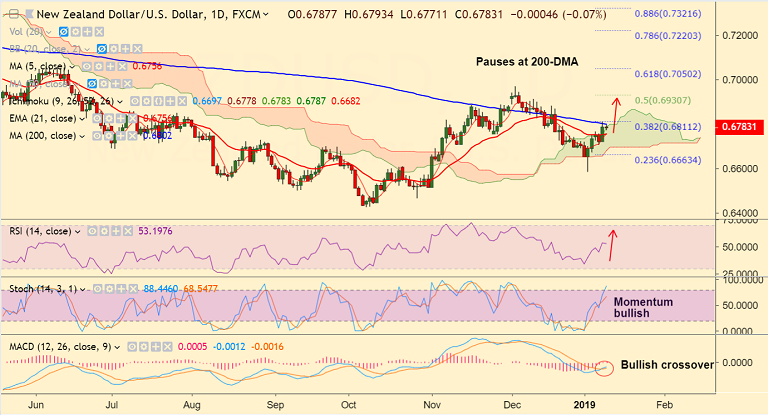
NZD/USD chart on Trading View used for analysis
- NZD/USD pauses upside at 200-DMA, break above to see further upside.
- Momentum studies are bullish. Stochs and RSI are biased higher.
- MACD is showing a bullish crossover on signal line which adds to the bullish bias.
- Break above 200-DMA will see test of 50% Fib at 0.6930 ahead of 0.6969 (Dec 4th high).
- On the flipside, rejection at 200-DMA will see dip till 5-DMA at 0.6755. Further weakness on brean below.
Support levels - 0.6755 (5-DMA), 0.67, 0.6663 (23.6% Fib)
Resistance levels - 0.6802 (200-DMA), 0.6930 (50% Fib)
For details on FxWirePro's Currency Strength Index, visit http://www.fxwirepro.com/currencyindex.


