


 FxWirePro: GBP/AUD bears maintain upper hand
  FxWirePro: NZD/USD consolidates overnight gains, but loses momentum
  Major European Indices Score Extremely Bullish: DAX Eyes 26000, CAC Targets 8600, FTSE100 at 11000 – Key Levels to Watch
  NZDJPY Retreats on Yen Strength – Bearish Setup Targets 90 After Hitting 92.75 Low
  AUDJPY Volatile After Massive Sell-Off: Sell Rallies at 113, Targeting 110 as Bearish Momentum Surges
  FxWirePro- Woodies pivot (Major)
  AUD/JPY Slips Below 112 as BOJ Intervention Sparks Bearish Momentum: Sell the Rallies
  FxWirePro: USD/CAD retreats after Canada posts stronger-than-expected GDP growth
  FxWirePro: GBP/NZD remains weak, eyes 38.2%fib support
  FxWirePro: USD/CNY dips to hit three year low,scope for further downside
  FxWirePro: AUD/USD gains some ground but outlook is bearish
  FxWirePro: GBP/AUD drifts lower after BOE rate decision
  FxWirePro- Major Pair levels and bias summary
  FxWirePro: GBP/USD rises as soft US data pressures dollar
  FxWirePro:USD/JPY climbs back above 160.00 after BOJ rate decision
  FxWirePro: USD/ZAR gains as stronger dollar outweighs upbeat South Africa's trade surplus


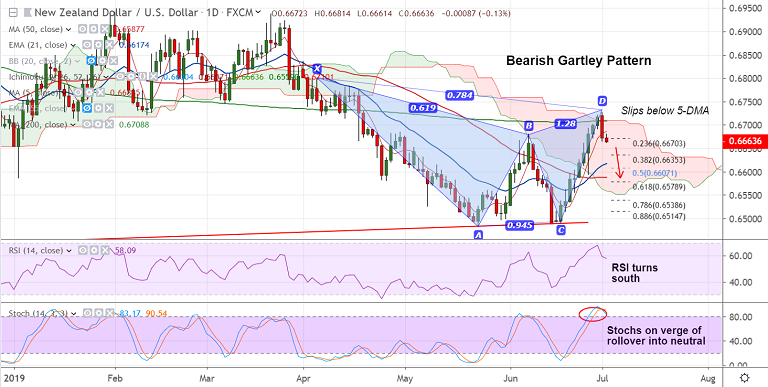
NZD/USD chart - Trading View
NZD/USD extends previous session's slump, trades 0.12% lower on the day at 0.6663 at 07:25 GMT.
Price action has slipped below 5-DMA and technical indicators are turning bearish.
The pair has retraced break above 200-DMA and daily cloud, breaks below 23.6% Fib.
RSI has turned south and Stochs are on verge of roll back from overbought levels.
A 'Bearish Gartley' pattern on the daily charts keeps scope for weakness. Decisive break below 23.6% Fib eyes 55-EMA at 0.6624.
New Zealand’s business confidence fell further in the June quarter as the general business sentiment fell from -28 to -31, its lowest level in 10 years adding to pressure on the kiwi.
Major trend is bearish. Pullback was capped at 200-DMA. Dip till 61.8% Fib at 0.6578 likely.
Bearish invalidation only on decisive break above 200-DMA.
Support levels - 0.6624 (55-EMA), 0.6617 (21-EMA), 0.6578 (61.8% Fib)
Resistance levels - 0.6686 (5-DMA), 0.6709 (200-DMA), 0.6733 (Upper BB)
For details on FxWirePro's Currency Strength Index, visit http://www.fxwirepro.com/currencyindex.


