


 Gold's 365-Day EMA Streak Since Oct 2023 Faces Its First Real Test at $3,980 — Break or Bounce to $4,140?
  Silver Cracks Key 365-Day EMA for First Time Since Feb 2024; Bears Eye $50 on Rallies
  Gold Surges Above Key EMAs, Bulls Eye Resistance Amidst Bullish Momentum
  Bank Regulation Rollbacks in the U.S. and UK Could Increase Financial Risks, Study Warns
  World Cup technology: from ref cams to AI analysts, cutting-edge research is changing the game
  AI Memory Boom Sparks Global Chip Supply Crunch
  How AI prompting turned writerly description into an everyday skill
  SpaceX Stock Gets $175 Target as Analysts See Massive Growth Ahead
  China’s AI Manufacturing Boom Masks Weak Consumer Economy, Citi Says


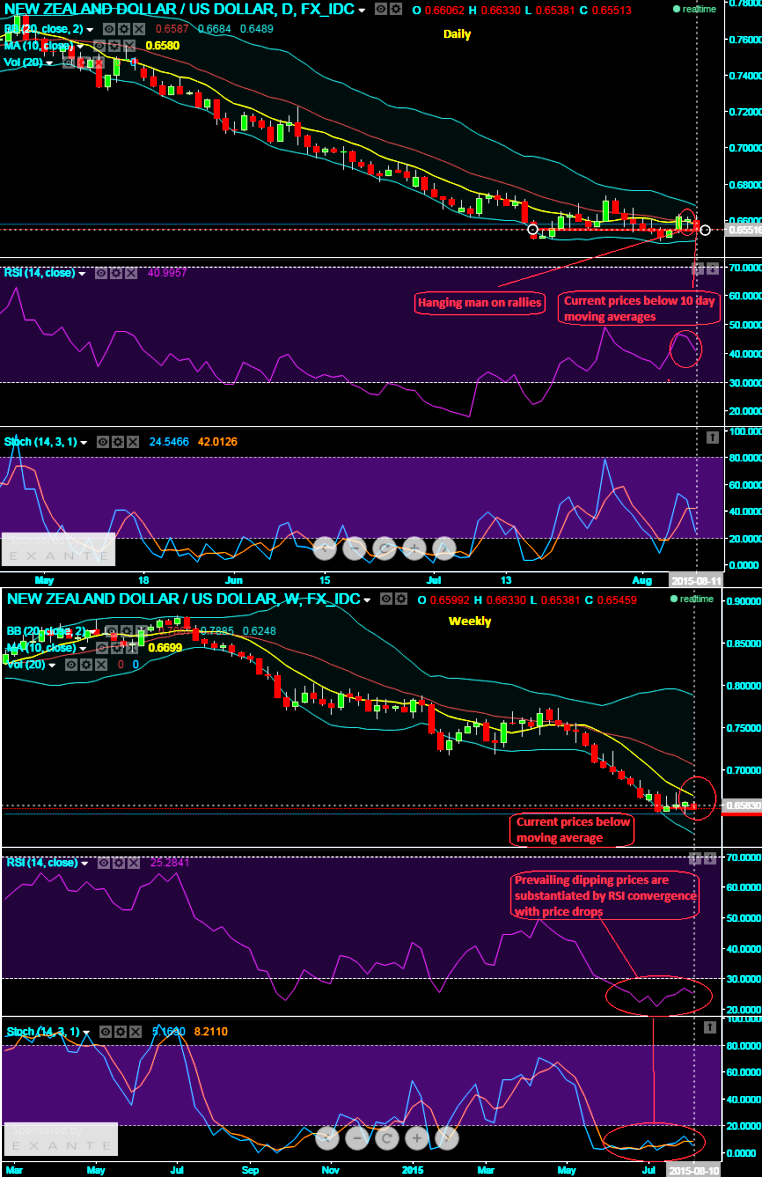
Technical glimpse:
The hanging man has occurred at short term rally that was spotted out in our earlier call. Hanging man at 0.6610 signifies a weakness in the pair again. The pair is now able to hold 6 years lows of NZD/USD as the other leading oscillators are converging downwards with dropping prices on intraday charts as well.
The downward convergence on RSI: The pair at this psychological juncture in the mood to break the supports at 0.6550 levels as 14 day RSI shows downward convergence with dipping prices as it has headed back 30 level which is oversold zone.
Stochastic supports momentum: To substantiate this view on weekly charts slow stochastic curves were attempting to remain in sync with standpoint offered by RSI. Currently, RSI (14) is trending at 40.9372, while %D line crossover below 20 signifies trend continuation which is bearish trend in long term.
10DMA: More importantly, our lagging indicator which signifies long term trend sentiments, as moving average of ten day time frame was also suggesting the prevailing daily prices are attempting to follow downtrend that has created during today's intraday rallies. The prevailing prices are running below moving average curve, hence it is a bearish trend to resume back again.
Trading tips: We look ahead for some minor dips as the long term downtrend to resume back again. The trade idea would be good to buy ATM binary puts on rallies for targets of 15-20 pips.

- News

- Economy

- Central Banks
- Investing
- Research
- Roundups
- Digital Currency
- Insights
- Technical Analysis
- Technology
- Business
- Law
- Health
- Nature
- Fintech
- Science
- Topic
- Opinions
- ©Econometrics LLC . All Rights Reserved.
FxWirePro: NZD/USD slumps crossing 10DMA, short correction over and downtrend to resume - binary puts for speculation
Tuesday, August 11, 2015 6:02 AM UTC
Editor's Picks


- Market Data
Most Popular


