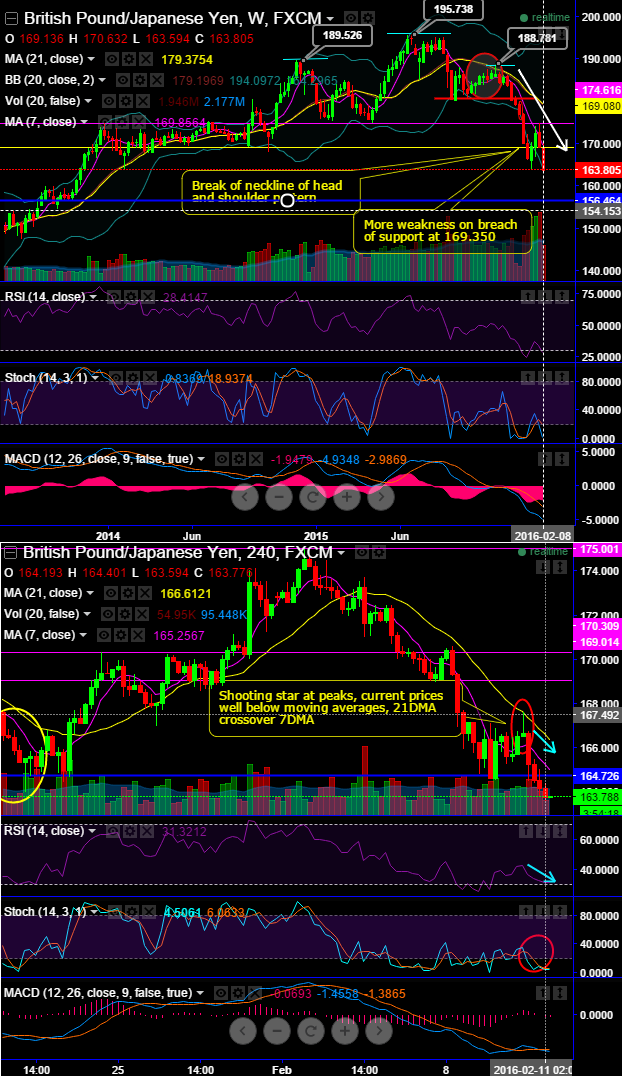
The shooting star formation at the peaks at around 166.690 on intraday chart evidences sharp dips with both leading and lagging indicators to converge these slumps. After yesterday's break below the supports at 164.726 levels it continue to evidence more slumps today as well.
To substantiate this bearish view, while plotting weekly charts we arive with a head and shoulder pattern with head peak at 195.883, left shoulder at 189.686 and right shoulder at 188.807, but for now the pair seems more vulnerable as it has broken neckline of this pattern at 174.616 and a crucial supports at 169.080.
While both momentum oscillators and lagging indicators are correspondingly converging to the exxisting declining rallies.
Slow stochastic has almost approached oversold region and still maintaining bearish crossover, while same is that case on RSI (14) as it shows converging these dips to intensify selling momentum even at oversold territory.
On monthly charts, for long term investors in this pair undoubtedly we continue to foresee further bearish travel from here onwards with some minor abrupt rallies.
Long term trend has been extremely conducive for bears as we listed out series of red flags that signifies serious weakness in this pair, most importantly, spiking volumes with dipping price.
So far, we see no harm for bears with medium term trade setups as lagging indicators are pretty much the same as leading indicators, MACD and 21DMA has still been a sell both on weekly and monthly graphs. The prices have slid well below 21DMA just a month ago on monthly chart that has created more room for ongoing bearish trend. 21DMA crossover above 7DMA doesn't even allow short term bullish opportunities.
Thereby, for now we still maintain the targets at 160.207 and even retesting of 156.480 levels are pretty much on the table in the days to come upon holding the above stated resistance levels.