


 FxWirePro: EUR/AUD downtrend loses steam but outlook still bearish
  FxWirePro: GBP/AUD positions for another drop, eyes 1.8900level
  Bitcoin’s Volatile Reset: ETFs Rebound as Bulls Eye USD 80,000 Milestone
  FxWirePro- Major Pair levels and bias summary
  FxWirePro: GBP/USD biased higher but rally currently stretched
  FxWirePro: USD/CNY neutral in the near-term, scope for downward resumption
  FxWirePro- Major Crypto levels and bias summary
  FxWirePro: GBP/NZD up trend gains some momentum but hurdles ahead
  Euro Holds the Line: EURUSD Finds Support at the 365-EMA as Peace Talks Loom
  FxWirePro: EUR/AUD under pressure as key support gives way
  FxWirePro: USD/CAD recovers slightly but bearish outlook persists
  Ethereum Consolidates: Bullish Technicals Point to a Potential $3,000 Breakout
  FxWirePro: GBP/AUD gains some upside momentum but still bearish
  Energy Surge Ignites US Inflation: USDCHF Eyes Support Amid Dollar Sell-Off
  FxWirePro: USD/ZAR edges lower ,investors remain on edge
  FxWirePro:NZD/USD uptrend loses momentum but bullish setup remains


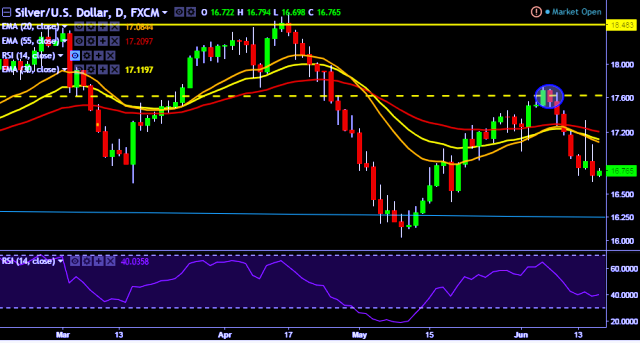
- XAG/USD is currently trading around $16.78 marks.
- It made intraday high at $16.79 and low at $16.69 levels.
- Intraday bias remains slightly bullish for the moment.
- A daily close above $16.72 will test key resistances at $16.95/$17.08/$17.22/$17.49/$17.68/$17.72/$17.98/$18.24 marks respectively.
- On the other side, a daily close below $16.72 will take the parity down towards key supports at $16.64/$16.52/$16.41/$16.28/$16.03 marks respectively.
- Important to note here that 20D, 30D and 55D EMA heads down and confirms the bearish trend in a daily chart. Current upside movement is short term trend correction only.
We prefer to go long on XAG/USD around $16.75 with stop loss at $16.62 and target of $17.02.


