


 FxWirePro: EUR/AUD loses upside momentum but outlook is bullish
  FxWirePro- Major Pair levels and bias summary
  Ethereum Cracks Under $1,700: Sell the Rally Near $1,750 as Bears Eye $1,380–$1,200
  FxWirePro: USD/JPY gains above 160 level ahead of BOJ policy meeting
  FxWirePro: AUD/USD climbs as US-Iran peace deal sparks risk rally
  Relief Rally Extends to 112.75, but AUDJPY EMA Structure Favors Selling
  FxWirePro: USD/CAD steadies around 1.3990 ,retains bid one
  FxWirePro- Major Crypto levels and bias summary
  FxWirePro: EUR/ NZD uptrend loses steam, remains on bullish path
  Geopolitical Easing Fuels AUDJPY Rally Toward 115 — Buy Dips at 113
  FxWirePro: NZD/USD jumps after US and Iran agree preliminary deal
  GBPJPY Coil Tightens: Is a Bullish Break Above 215.60 Imminent?
  FxWirePro: USD/ZAR edges higher, set to stay on back foot


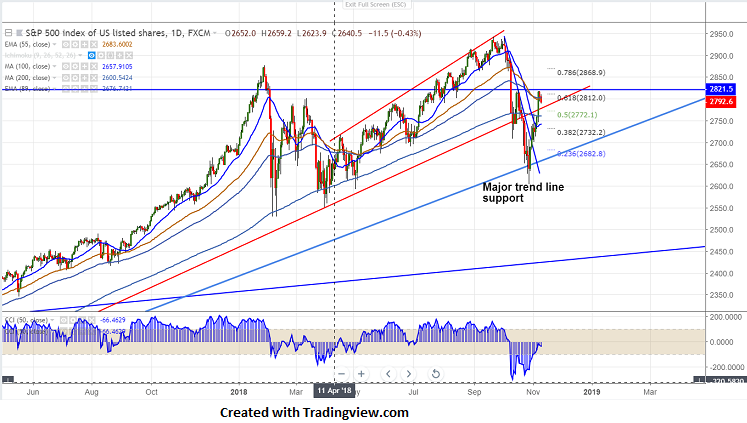
Short term trend Slightly bearish
Chart pattern- Double top
Major resistance 2821
S&P500 has shown a huge jump minor decline of 30 points from high of 2818.The index jumped more than 8% from low of 2603. The index has declined on account of hawkish Fed policy. Any break above 2821 confirms bullish continuation. It is currently trading at 2793.80 (0.40% lower).
The index’s near term resistance is around 2820 and any break above targets 2850/2900. Any break above 2821 confirms minor bullishness.
On the lower side, near term support is around 2761 (200- day MA) and any break below targets 2735/2700.
It is good to sell on rallies around 2800-2805 with SL around 2822 for the TP of 2745.


