


 Best Gold Stocks to Buy Now: AABB, GOLD, GDX
  Gold Prices Fall Amid Rate Jitters; Copper Steady as China Stimulus Eyed


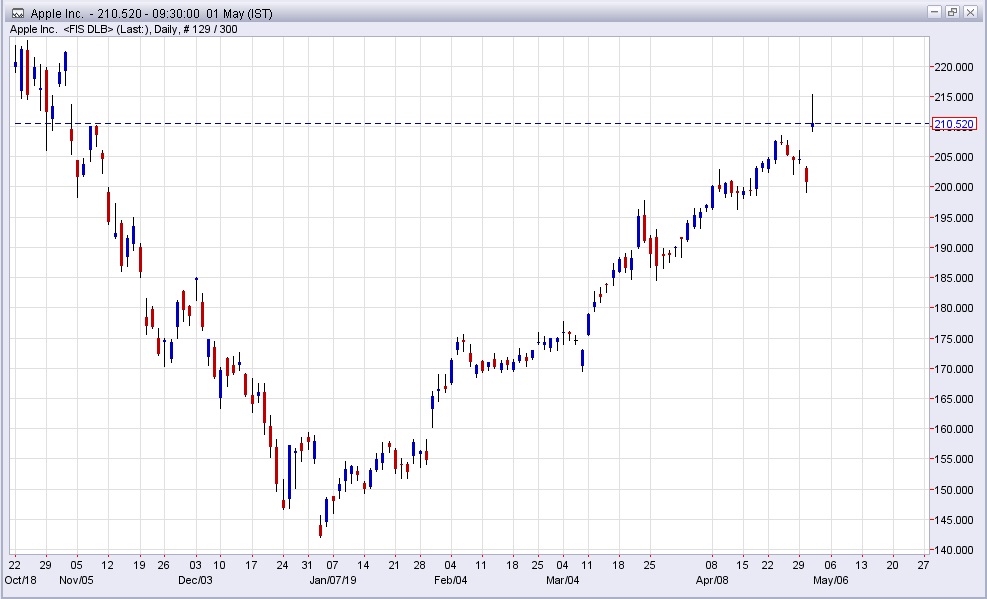
The chart above is the daily chart of Apple Inc., which clearly suggests that the stock price of the world’s one of the most premier companies is about to see some major sell-offs.
- The price of Apple Inc. has been in decline since last week, but better than expected earnings numbers, released this week has pushed the price from $200 to as high as $215 per share.
- However, it suffered sell-offs after reaching $215 area and price action formed a bearish inverted hammer candle in the daily chart, which is significantly bearish.
- Apple Inc. is currently trading at $210.5 and we expect the price to decline by at least 5 percent and retest the support around $200 area.
With Apple Inc. set to decline, the question comes whether S&P500 would follow suit or not.
- Yesterday, S&P500 also suffered major selloffs. While it is likely that the index would decline further, the price action has not been as decisive as Apple Inc.
- S&P500 is still in a bullish trend and lower value would surely attract buyers.
- Moreover, the retail sentiment strongly suggests that the broader bull-trend is still intact in S&P500.
- The sentiment reports from IG Markets, which is a UK-based company providing trading in financial derivatives such as contracts for difference and financial spread betting, provides clues to future movement through retail positioning.
- IG markets’ retail positions data provide a glimpse to retail traders’ positions, which are largely used a contrarian indicator since retail positioning moves in the opposite direction to market movements.
- The latest numbers indicate that 72 percent of the retail positions are short on S&P500, which gives the index a bullish bias.


