


 FxWirePro: EUR/AUD falls below 1.6600 level, plunge to test a key fibo grows
  NZDJPY Bearish Breakdown: Why Selling the Rallies is the Strategic Play
  FxWirePro: EUR/ NZD consolidating around 2.0200, room for further gains
  FxWirePro: AUD/USD slips amid wavering risk sentiment
  FxWirePro- Major Pair levels and bias summary
  FxWirePro- Major Crypto levels and bias summary
  FxWirePro: USD/ZAR continues to recovers , upside pressure builds
  FxWirePro: USD/JPY edges up as yen dips after soft household spending data
  FxWirePro: USD/CNY falls to three-year high, scope for further downside
  Ethereum Braces for Volatility: Technicals Turn Bearish as Geopolitical Tensions Loom
  FxWirePro: EUR/ NZD downside pressure builds, key support level in focus
  EUR/JPY Breaks Out: Euro Surges Past 185.00 Resistance Amid Strong Bullish Momentum
  FxWirePro: EUR/AUD eases as market awaits Iran deadline
  Bitcoin's Tug-of-War: Bulls Eye 80,000 USD Despite Turbulent ETF Outflows
  FxWirePro: GBP/NZD edges up, remains on front foot


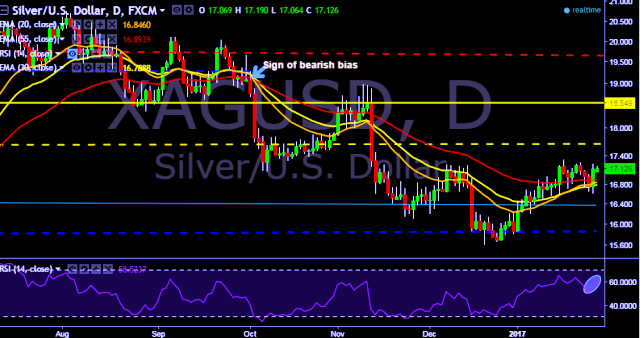
- XAG/USD is currently trading around $17.12 marks.
- It made intraday high at $17.19 and low at $17.06 levels.
- Intraday bias remains bullish till the time pair holds key support at $16.99 mark.
- A daily close above $17.12 will test key resistances at $17.26/$17.35/$17.48 marks respectively.
- On the other side, a daily close below $17.12 will take the parity down towards key supports at $16.99/$16.85/$16.70/$16.57/$16.37/$16.20/$16.05 marks respectively.
- Important to note here that 20D, 30D and 55D EMA heads down and confirms the bearish trend in a daily chart. Current upside movement is short term trend correction only.
We prefer to go long on XAG/USD around $17.12 with stop loss at $16.99 and target of $17.26/$17.35.


