


 FxWirePro- Woodies Pivot(Major)
  FxWirePro- Major Pair levels and bias summary
  FxWirePro:NZD/USD uptrend loses momentum but bullish setup remains
  FxWirePro: AUD/USD retreats slightly but trend is still bullish
  FxWirePro- Major European Indices
  Ethereum’s Healthy Correction: Bulls Eye Strategic Re-Entry at 2,150 USD Following Profit-Booking Pullback
  Energy Surge Ignites US Inflation: USDCHF Eyes Support Amid Dollar Sell-Off
  FxWirePro: EUR/AUD under pressure as key support gives way
  FxWirePro: USD/ZAR edges lower ,investors remain on edge
  FxWirePro: USD/CNY neutral in the near-term, scope for downward resumption
  FxWirePro: GBP/USD bulls remain cautiously optimistic
  Ethereum Consolidates: Bullish Technicals Point to a Potential $3,000 Breakout
  FxWirePro: USD/CAD extends decline on broad dollar weakness
  FxWirePro -Major European Indices
  NZDJPY Bulls Charge Toward 95.00: Safe-Haven Exodus Drives Kiwi Rally


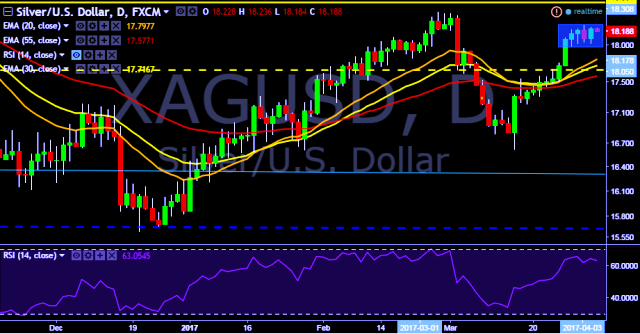
- XAG/USD is currently trading around $18.18 marks.
- It made intraday high at $18.23 and low at $18.18 levels.
- Intraday bias remains neutral till the time pair holds key resistance at $18.22 mark.
- A daily close above $18.22 will test key resistances at $18.27/$18.48/$18.72/$18.88 marks respectively.
- On the other side, a daily close below $18.22 will take the parity down towards key supports at $18.01/$17.90/$17.72/$17.51/$17.42/$17.22/$17.09/$16.87/$16.65/$16.48/$16.36/$16.23/$15.85 marks respectively.
- Important to note here that 20D, 30D and 55D EMA heads up and confirms the bullish trend in a daily chart. Current downside movement is short term trend correction only.
We prefer to go long on XAG/USD only above $18.22 with stop loss at $17.98 and target of $18.48.


