


 FxWirePro: GBP/AUD steadies around 1.9310,retains bid tone
  FxWirePro- Major Pair levels and bias summary
  FxWirePro: USD/JPY slides as yen rallies on Japan pension fund plans
  FxWirePro- Woodies pivot (Major)
  EURJPY Climbs Above 185.50 on Euro Buying: Bullish Momentum Intact, Buy Dips Toward 187
  FxWirePro: AUD/USD edges higher as USD weakens broadly
  Gold Surges Above $4100 Amid Geopolitical Tensions: Buy Dips Toward $4247
  FxWirePro- Major Crypto levels and bias summary
  FxWirePro- Major Pair levels and bias summary
  NZDJPY Surges on NZD Buying: Bullish Setup Eyes 95 as Key Support Holds
  FxWirePro- Major Crypto levels and bias summary
  FxWirePro: USD/ZAR slips as rand gains despite weak manufacturing data
  AUDJPY Pulls Back as Yen Momentum Returns: Sell Rallies Near 112.60 Targeting 110
  GBPJPY Eases on Profit Booking: Bullish Momentum Holds, Buy Dips Toward 220
  FxWirePro: USD/CNY Slips as strong PBOC fixing lifts Chinese Yuan


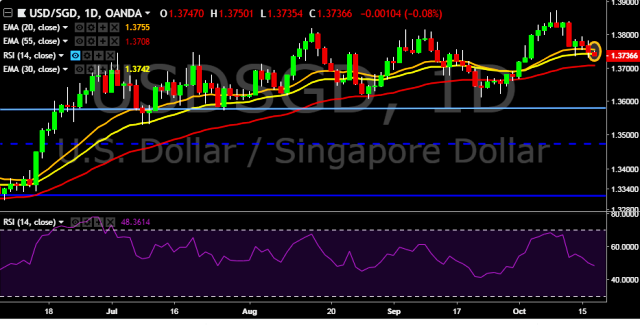
- USD/SGD is currently trading around 1.3735 marks.
- It made intraday high at 1.3750 and low at 1.3734 levels.
- Intraday bias remains bearish till the time pair holds key resistance 1.3790 marks.
- A daily close above 1.3747 will test key resistances at 1.3790, 1.3840, 1.3872, 1.3905 and 1.3948 levels respectively.
- Alternatively, a consistent close below 1.3747 will drag the parity down towards key supports at 1.3738/1.3690/1.3654/1.3620/1.3570/1.3510/1.3450 levels respectively.
- Important to note here that 20D, 30D and 55D EMA heads up and confirms the bullish trend in a daily chart. Current downside movement is short term trend correction only.
- Singapore Sep 2018 non - oil exports mm decrease to -4.3 % vs previous 0.4 %.
- Singapore Sep 2018 non - oil exports yy increase to 8.3 % vs previous 5 %.
We prefer to take short position on USD/SGD around 1.3742, stop loss at 1.3790 and target of 1.3690/1.3654.


