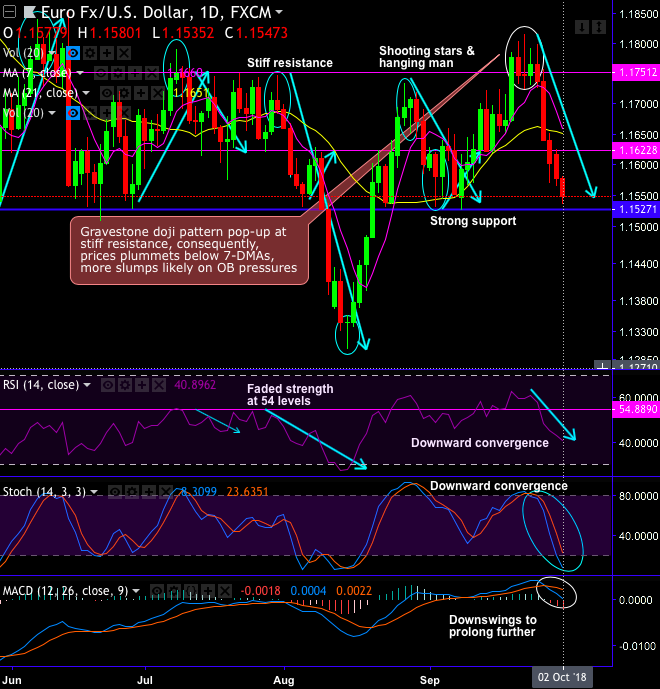
EURUSD forms gravestone doji pattern at 1.1747 levels, consequently, steep price slumps are observed below 7-DMAs (refer daily chart),
Stiff resistance is seen at 1.1751 levels, shooting stars and hanging man pop-up at this juncture.
As per our long-term analysis, the major trend has been sliding through sloping channel (refer monthly chart), where the shooting star pattern pops-up exactly at channel resistance, ever since then you could make out bears have shown their effects, steep slumps have gone below EMA levels and retraced more than 50% Fibonacci levels of January 2018 highs (i.e. 1.2612) and January 2017 lows (i.e. 1.0371 levels).
You could easily observe, as and when such patterns pop up at the stiff resistance levels, failure swings have taken the downtrend upto channel support.
For now, the major trend is stuck between 38.2% & 50% Fibonacci levels. The current price still remains below 21-EMAs despite ongoing rallies as both leading oscillators signal bearish momentum, in a medium-run, bears are likely to extend 1-year lows, and most likely to retrace 61.8% Fibonacci levels.
Overall, we could foresee more slumps on cards as both leading oscillators (RSI and stochastic curves) and both trend indicators (DMAs & MACD) have been signaling intensified bearish momentum and downtrend continuation respectively.
At spot reference: 1.1530 levels, contemplating above technical rationale, one can bid one-touch put options. Such exotic option with strikes at 1.1442 (i.e. 50% fibos).
Alternatively, on hedging grounds, one can also initiate shorts in futures contracts of mid-month tenors with a view to arresting bearish risks.
Currency Strength Index: FxWirePro's hourly EUR spot index is inching towards -137 levels (which is bearish), while hourly USD spot index was at 132 (bearish) while articulating (at 07:37 GMT). For more details on the index, please refer below weblink:
http://www.fxwirepro.com/currencyindex
These indices are also conducive for the above trading strategy.


