


 Indonesia Plans Higher Asset Yields to Boost Rupiah and Restore Investor Confidence
  China's Refining Industry Faces Major Shakeup Amid Challenges
  U.S. Banks Report Strong Q4 Profits Amid Investment Banking Surge
  Gold Prices Slide as Rate Cut Prospects Diminish; Copper Gains on China Stimulus Hopes
  Global Markets React to Strong U.S. Jobs Data and Rising Yields
  BOJ Rate Hike Expected to Boost Yen, Impact USD/JPY and Nikkei
  Indian Government Bonds Seen Opening Steady Ahead of RBI Policy Decision
  Trump’s "Shock and Awe" Agenda: Executive Orders from Day One
  New Zealand Unemployment and Inflation Debate Intensifies Ahead of 2026 Election
  Fed May Resume Rate Hikes: BofA Analysts Outline Key Scenarios
  ECB Set to Raise Interest Rates as Energy Shock Fuels Eurozone Inflation Concerns
  Wall Street Analysts Weigh in on Latest NFP Data
  South Korea Signals Possible Interest Rate Hike as Inflation Remains Elevated


Despite the mild rallies of AUDUSD during New Year season, bears have resumed again, and we continue to expect modest depreciation towards 0.68 levels by Q1 end contemplating JPM’s forecasts and assumptions that global growth will remain slightly above trend into 2019. And while China’s growth has down-shifted another gear, this has occurred mostly through the trade channel, with stabilization in FAI and shuttering of domestic commodity production proving supportive for global iron ore and coal prices.
Positive terms of trade dynamics, therefore, anchor the longer-run FV metrics for AUD at relatively healthy levels.
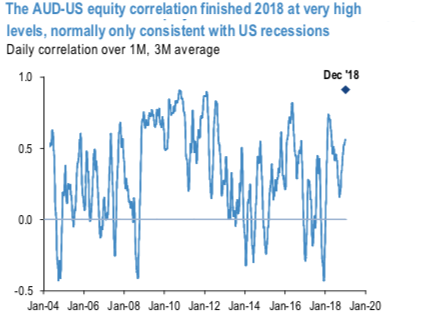
We expect the currency will trade at around a 10% discount to such estimates this year, driven by narrowing (more negative) rate spreads, and re- 0 escalation of trade tensions. But meaningful depreciation beyond that seems to require a US/global recession: AUDUSD 1M correlation to US equities is already in the upper quartile or observations over the last 15 years (refer 1st chart). Through most of December, the correlation traded in the 90thpercentile.
The central bank policy question in the near-term is whether the RBA will abandon their (softly-held) tightening bias. RBA guidance has long suggested the next move in rates is likely up. But a much weaker housing market (refer 2nd chart) and softer GDP growth have seen officials waver on this message of late. The board’s guidance to shift to an on-hold outlook in the next minutes in mid-February would be the green light for pricing of rate cuts this year. We do not expect the RBA to fully abandon the eventual rate hike message but were that to happen, it would clearly help the argument that rate spreads will overpower positive terms of trade backdrop for AUD.
Technically, although AUDUSD interim bulls attempted of-late to bounce back, the failure swings are observed at 0.7235 levels. The major downtrend has also extended on streaks of bearish patterns, such as hanging man, engulfing & spinning top candlesticks and double top chart patterns. These bearish patterns are coupled with momentum indicators signal intensified bearish interests.
AUD OTC updates: Please be noted that the AUDUSD positively skewed IVs of 3m tenors signify the hedgers’ interests to bid OTM put strikes up to 0.6950 levels which are in line with the above projections and the underlying price movements (refer 1st nutshell).
For substantiation, fresh negative numbers in 1m tenors, while bearish neutral risk reversals of the 3m tenors signal that the hedging activities for further downside risks, refer 2nd (RR) nutshell. Courtesy: JPM
Currency Strength Index: FxWirePro's hourly AUD spot index is inching towards -61 levels (which is bearish), hourly USD spot index was at 63 (bullish), while articulating (at 11:29 GMT).
For more details on the index, please refer below weblink: http://www.fxwirepro.com/currencyindex


