


 Relief Rally Extends to 112.75, but AUDJPY EMA Structure Favors Selling
  Geopolitical Easing Fuels AUDJPY Rally Toward 115 — Buy Dips at 113
  FxWirePro: GBP/USD range-bound as Iran uncertainty keeps traders cautious
  FxWirePro: GBP/NZD stuck in range but outlook is bullish
  FxWirePro: USD/ZAR edges higher, set to stay on back foot
  FxWirePro: GBP/AUD runs out of steam but maintains bullish outlook
  FxWirePro- Woodies pivot (Major)
  FxWirePro- Major Pair levels and bias summary
  GBPJPY Coil Tightens: Is a Bullish Break Above 215.60 Imminent?
  FxWirePro: AUD/USD climbs as US-Iran peace deal sparks risk rally
  FxWirePro: GBP/AUD eases on Geopolitical whipsaw
  FxWirePro: NZD/USD jumps after US and Iran agree preliminary deal
  FxWirePro: USD/ CNY falls towards 6.750, bears keep the advantage
  FxWirePro: USD/CAD steadies around 1.3990 ,retains bid one
  FxWirePro- Major Crypto levels and bias summary


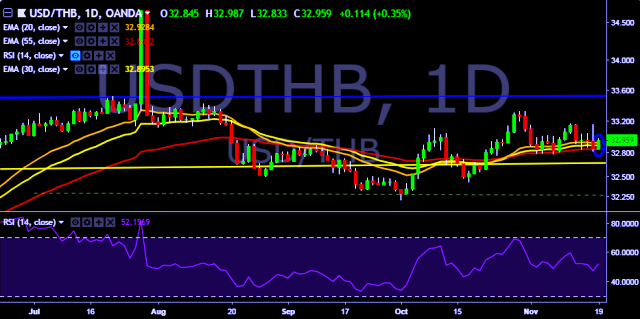
- USD/THB is currently trading around 32.96 marks.
- It made intraday high at 32.98 and low at 32.83 marks.
- Intraday bias remains slightly bullish for the moment.
- On the top side, key resistances are seen at 33.02, 33.15, 33.32, 33.52, 33.78 and 33.96 marks respectively.
- Alternatively, a daily close below 32.82 will drag the parity down towards key supports around 32.68, 32.57, 32.42, 32.20 and 32.07 marks respectively.
- Important to note here that 20D, 30D and 55D EMA heads up and confirms the bullish trend in a daily chart.
- Thailand Q3 2018 GDP growth yy decrease to 3.3 % (forecast 4.2 %) vs previous 4.6 %.
We prefer to take long position on USD/THB around 32.92, stop loss 32.80 and target of 33.02/33.15.


