


 FxWirePro: USD/CNY dips to hit three year low,scope for further downside
  DAX & CAC40 Score Perfect 100 Trend, FTSE100 Lags at 85 – Key Levels to Watch on the Perfect Scorers
  FxWirePro- Major Pair levels and bias summary
  Major European Indices Score Extremely Bullish: DAX Eyes 26000, CAC Targets 8600, FTSE100 at 11000 – Key Levels to Watch
  US Magnificent 7 Stocks Trend Score: Amazon & Microsoft Hit Extreme Bullish (+100) as Meta Drops to -100 — Key Resistance & Support Watchlist
  FxWirePro: EUR/ AUD dips below 1.6400 level, focus on near term support
  FxWirePro: USD/JPY dips as market assess risk of additional FX intervention.
  FxWirePro: GBP/NZD remains weak, eyes 38.2%fib support
  FxWirePro: USD/CAD retreats after Canada posts stronger-than-expected GDP growth
  Nikkei Surges Past 65,000 on Suspected Yen Weakness: Tech Giants Like Advantest and NEC Lead Explosive Gains
  JPY Currency Meter Signals: NZDJPY Bullish (+25) vs CHFJPY (-100) – These Pairs Could Move Next
  FxWirePro: USD/CNY downtrend loses steam, remains on bearish path
  All Major JPY Pairs Hit Extreme Bearish Score of -100: USDJPY, EURJPY, GBPJPY, AUDJPY, NZDJPY & CADJPY Flash Maximum Weakness
  FxWirePro- Major Crypto levels and bias summary
  FxWirePro: GBP/NZD remains weak, eyes 38.2%fib support
  FxWirePro- Woodies pivot (Major)


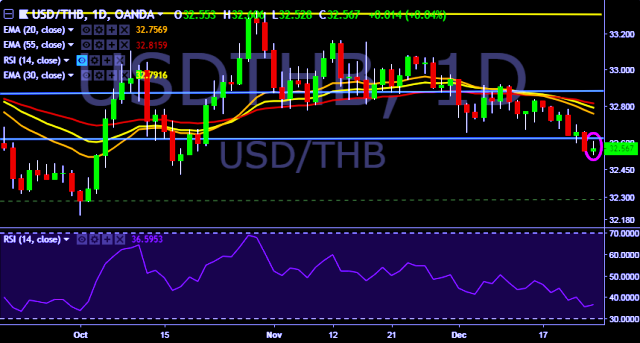
- USD/THB is currently trading around 32.56 marks.
- It made intraday high at 32.60 and low at 32.52 marks.
- Intraday bias remains bearish till the time pair holds immediate resistance at 32.70 mark.
- On the top side, key resistances are seen at 32.70, 32.83, 32.92, 33.07, 33.15, 33.32 and 33.52 marks respectively.
- Alternatively, a daily close below 32.55 will drag the parity down towards key supports around 32.42, 32.20 and 32.07 marks respectively.
- Important to note here that 20D, 30D and 55D EMA heads down and confirms the bearish trend in a daily chart.
We prefer to take short position on USD/THB around 32.55, stop loss at 32.83 and target of 32.42/32.20.


