


 NZDJPY Retreats on Yen Strength – Bearish Setup Targets 90 After Hitting 92.75 Low
  FxWirePro: GBP/AUD bears maintain upper hand
  FxWirePro: USD/ZAR gains as stronger dollar outweighs upbeat South Africa's trade surplus
  US Magnificent 7 Stocks Trend Score: Amazon & Microsoft Hit Extreme Bullish (+100) as Meta Drops to -100 — Key Resistance & Support Watchlist
  FxWirePro: GBP/NZD remains weak, eyes 38.2%fib support
  FxWirePro:USD/JPY climbs back above 160.00 after BOJ rate decision
  FxWirePro- Major Crypto levels and bias summary
  FxWirePro- Major Pair levels and bias summary
  FxWirePro: AUD/USD cedes early gains ,outlook bearish
  FxWirePro: GBP/USD rises as soft US data pressures dollar
  FxWirePro: AUD/USD gains some ground but outlook is bearish
  FxWirePro: NZD/USD consolidates overnight gains, but loses momentum
  US Magnificent 7 Stocks Trend Score: Amazon & Microsoft Hit Extreme Bullish (+100) as Meta Drops to -100 — Key Resistance & Support Watchlist
  FxWirePro: USD/JPY dips as market assess risk of additional FX intervention.
  FxWirePro: USD/CAD retreats after Canada posts stronger-than-expected GDP growth
  FxWirePro: GBP/NZD remains weak, eyes 38.2%fib support


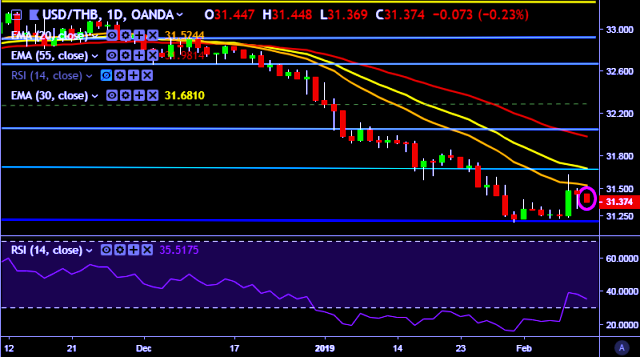
- USD/THB is currently trading around 31.36 marks.
- It made intraday high at 31.44 and low at 31.36 marks.
- Intraday bias remains bearish till the time pair holds key resistance at 31.50 mark.
- On the top side, key resistances are seen at 31.47, 31.62, 31.70, 31.93, 32.02 and 32.10 marks respectively.
- Alternatively, a daily close below 31.44 will drag the parity down towards key supports around 31.30, 31.18, 31.10 and 30.94 marks respectively.
- Important to note here that 20D, 30D and 55D EMA heads down and confirms the bearish trend in a daily chart.
We prefer to take short position on USD/THB around 31.38, stop loss at 31.50 and target of 31.22 mark.


